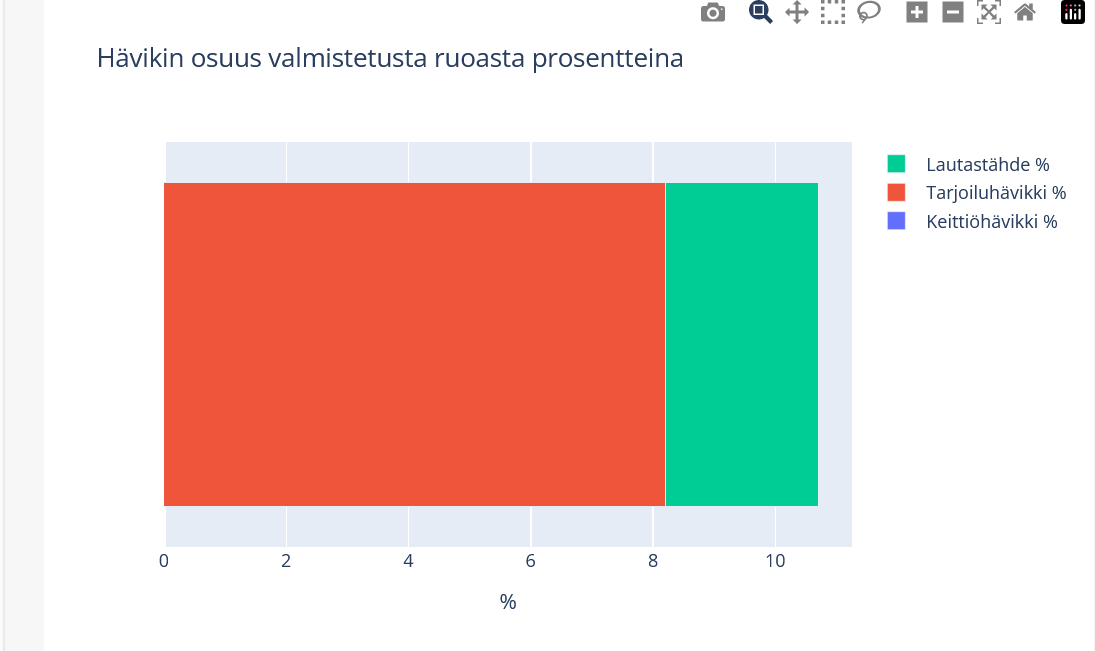
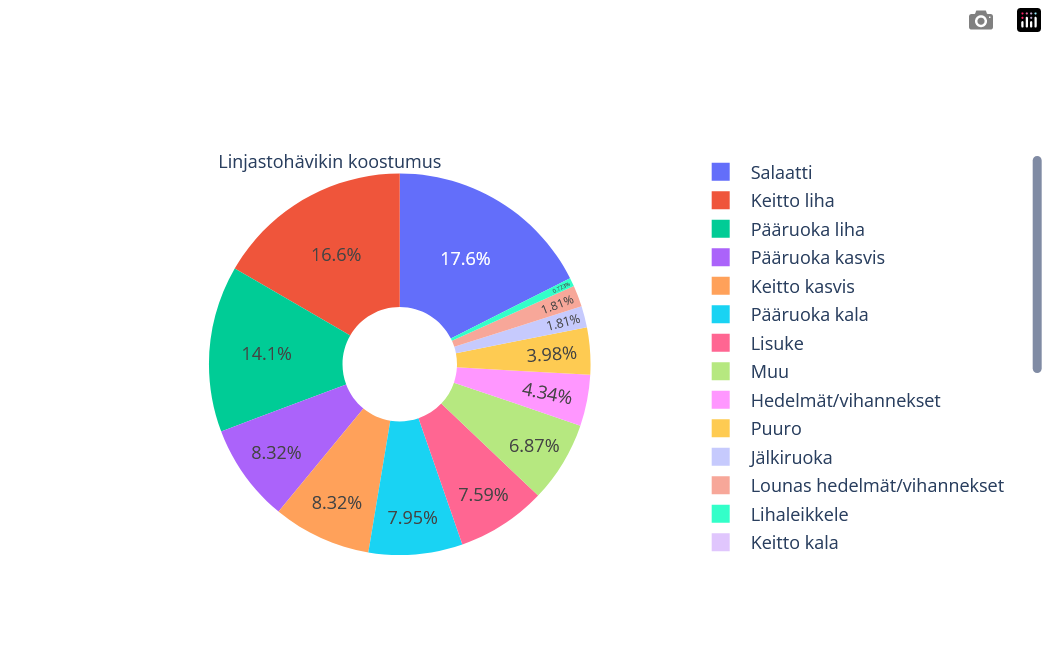
I have an app which displays both go.Bar and go.Pie objects. However, go.Pie has less user options (see the pictures’ upper right corners below) than go.Bar and the title is small. The title seems to be also a bit off from the right position. Both plots are displayed in a FastListTemplate and the Python code for generating them is identical, only the argument for add_trace() differs. The go.Bar seems to be drawn on top of empty go.Figure and the go.Pie seems to cover the empty go.Figure completely so the grid is not visible in the background. If this is normal behaviour, then why doesn’t go.Pie offer the same options for the user? Instead, there’s only an option for downloading the chart.
Code snippets:
case 'Waste percents':
            for i, value in enumerate(result.columns):
                fig.add_trace(
                    Bar(
                        y=[''],
                        x=[result.iloc[0,i]],
                        name=value,
                        orientation='h'
                    )
                )
            fig.update_layout(
                title='Hävikin osuus valmistetusta ruoasta prosentteina',
                xaxis_title='%',
                barmode='stack'
            )
            fig.update_traces(hovertemplate='%{y:.1f}%{x}')

case 'Service line product waste':
            fig.add_trace(
                Pie(
                    labels=result.columns,
                    values=result.iloc[0,:].values.tolist(),
                    #title='Linjastohävikin koostumus',
                    title=dict(
                        text='Linjastohävikin koostumus',
                        position='top center'
                    ),
                    hole=0.3,
                    textposition='inside',
                    hovertemplate='%{label}<br>%{value:.1f}%<extra></extra>'
                )
            )