Hi, thanks for your reply !
Since this code is part of a larger project, I cannot paste exactly the same code, but I have stripped down the code to create a snippet to reproduce error, you should be able to run it.
I tried to attach a csv file, but i’m not able to since I’m new, so here is a link to download it.
https://filebin.net/2jy5jyhpi35ut2hy/data.csv?t=jid1bnjr
And here is the code, you can test using matplotlib and bokeh by changing ‘back’, or test by saving or not using ‘plot’. I use save, but it does not seems to be the issue since the error arise both when plotting and saving
import pandas as pd
from typing import List, Union
import holoviews as hv
from holoviews.element.graphs import layout_nodes
import networkx as nx
from holoviews import opts, dim
def plot_graph(data: pd.DataFrame, features_columns: List[str], plot: bool=True, backend: str=None)-> Union[bool, hv.Overlay]:
"""
plot a graph
Args:
data: (pd.DataFrame) dataframe
cols_names: (List[str]) names of columns source, dest, value
plot: (bool) wether to plot directly or return the plot object
backend: (str) holoviews backend use to render
Returns:
if plot true:
bool: True
if plot false:
hv.Overlay: the holoviews overlay object ready to plot
"""
source, target, value = features_columns[0], features_columns[1], features_columns[2]
df_links = data[[source, target, value]].rename(columns={source: "source", target: "target", value: "value"})
df_nodes = pd.DataFrame({'name':pd.concat([df_links.source, df_links.target]).drop_duplicates()})
nodes = hv.Dataset(df_nodes, 'name')
as_graph = hv.Graph((df_links, nodes), ['source', 'target'], label="Airports flight connexions")
as_graph = layout_nodes(as_graph, layout=nx.layout.fruchterman_reingold_layout)
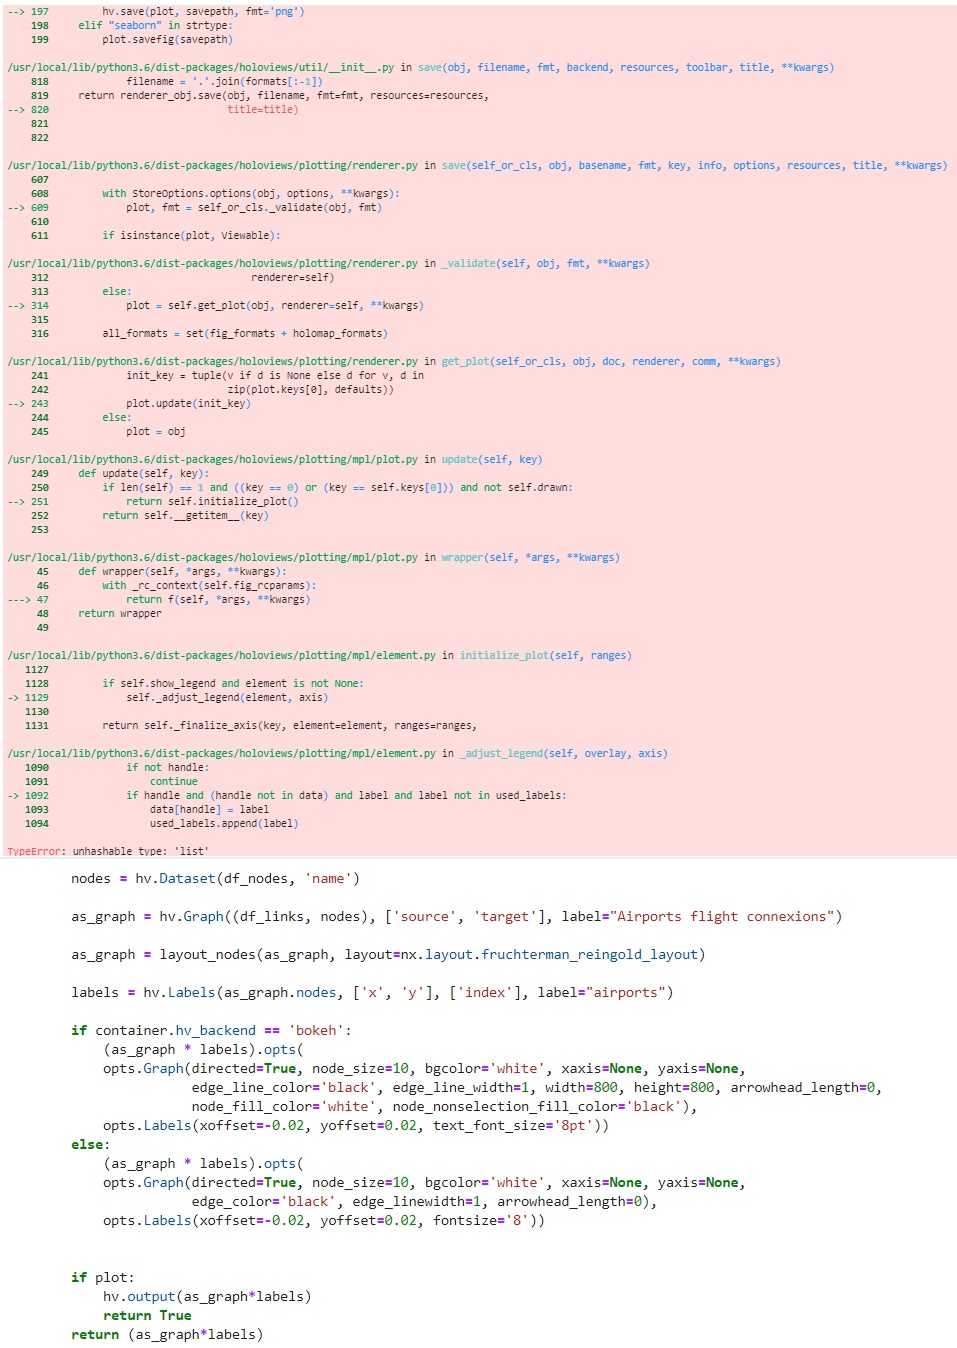
labels = hv.Labels(as_graph.nodes, ['x', 'y'], ['index'], label="airports")
if backend == 'bokeh':
(as_graph * labels).opts(
opts.Graph(directed=True, node_size=10, bgcolor='white', xaxis=None, yaxis=None,
edge_line_color='black', edge_line_width=1, width=800, height=800, arrowhead_length=0,
node_fill_color='white', node_nonselection_fill_color='black'),
opts.Labels(xoffset=-0.02, yoffset=0.02, text_font_size='8pt'))
else:
(as_graph * labels).opts(
opts.Graph(directed=True, node_size=10, bgcolor='white', xaxis=None, yaxis=None,
edge_color='black', edge_linewidth=1, arrowhead_length=0),
opts.Labels(xoffset=-0.02, yoffset=0.02, fontsize='8'))
if plot:
hv.output(as_graph*labels)
return True
return (as_graph*labels)
data = pd.read_csv("data.csv")
##variables##
plot = True
back = 'matplotlib'
#######
hv.extension(back)
graph = plot_graph(data, ["adep", "ades", "count"], plot=plot, backend=back)
if not plot:
hv.save(graph, "graph.png", fmt='png')