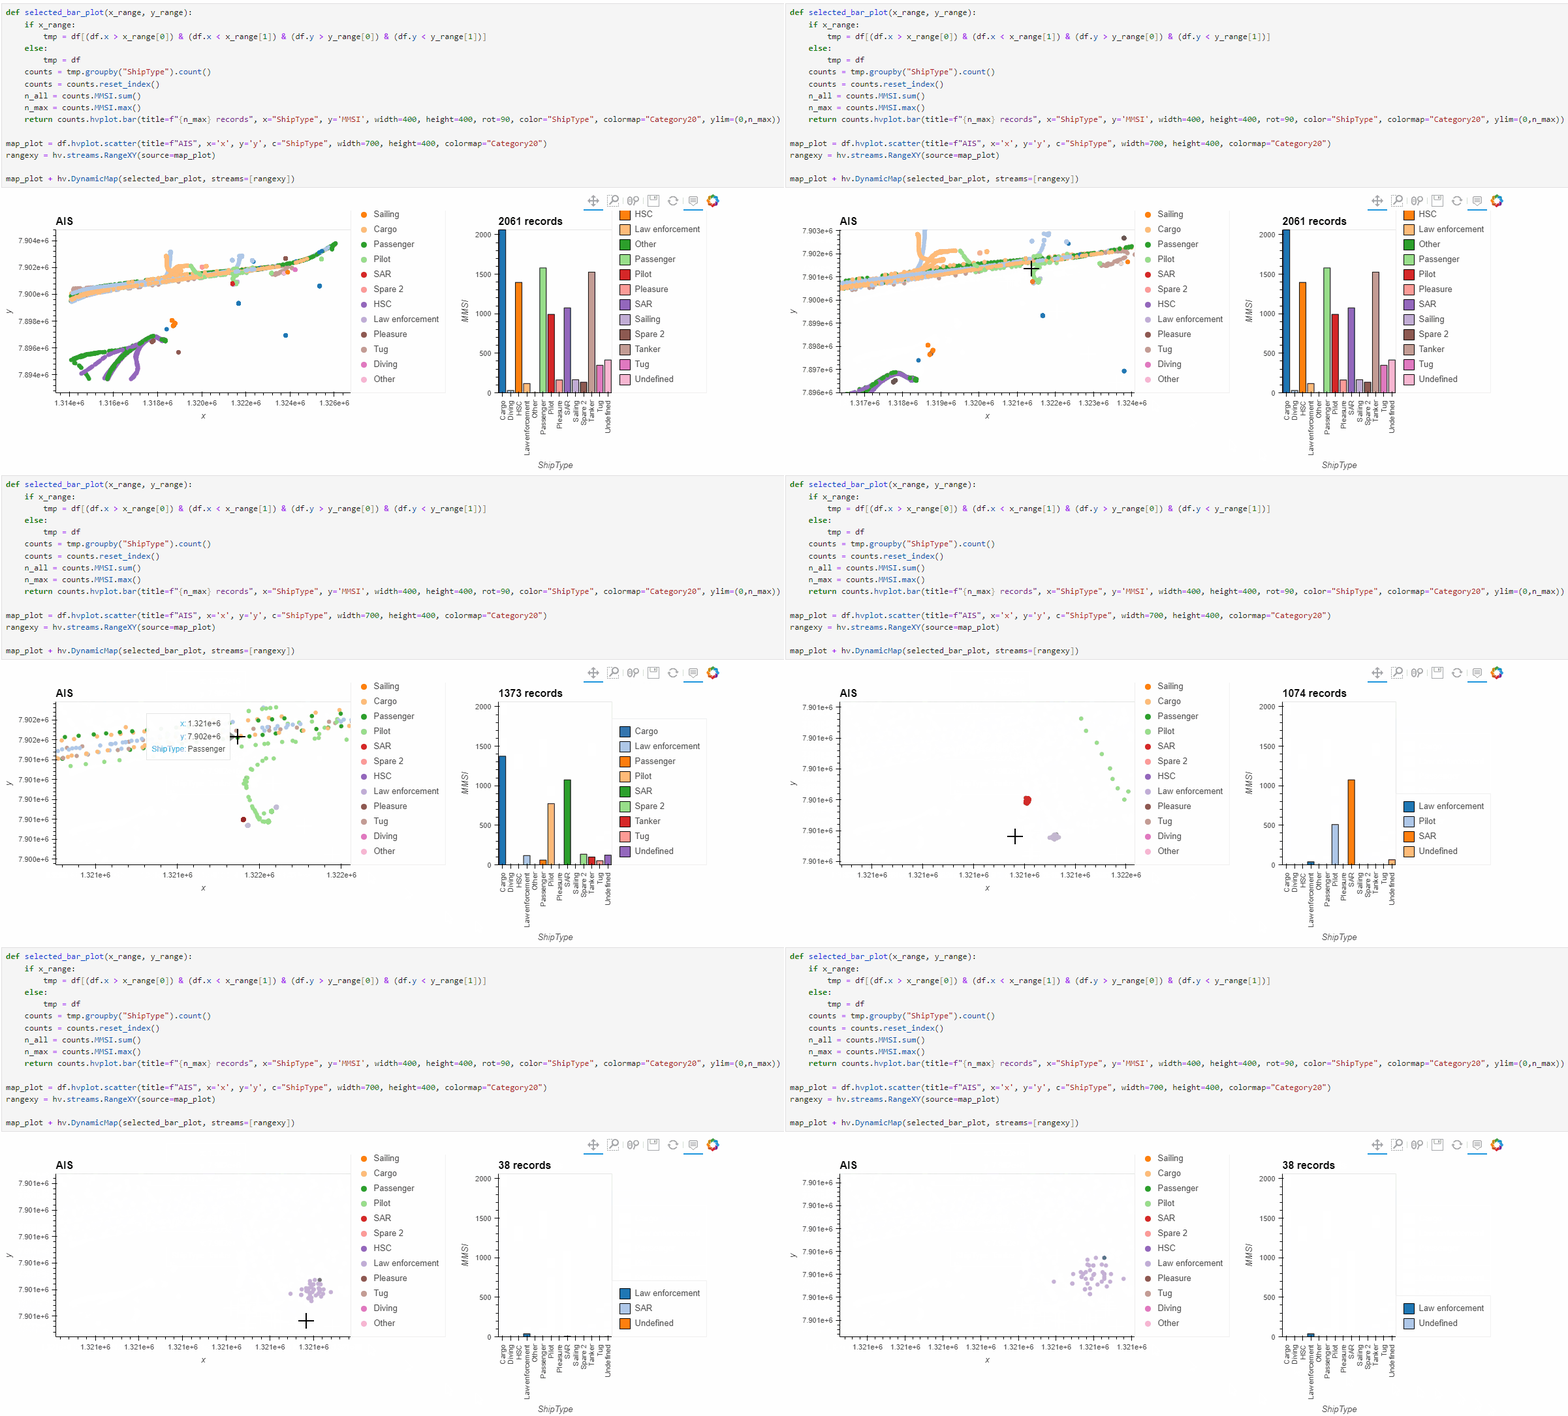
I am trying to link a scatterplot to a bar plot. The bar plot should update when the user zooms in the scatterplot. The basic logic is working but I cannot update the x or y axis limits. I’ve had a look at previous questions, specifically:
-
How to update limits for DynamicMap overlays? (franewise doesn’t seem to make a difference)
-
How to make DynamicMap adopt to yaxis range/limits change? - #4 by xavArtley (specific to pn.interact which I’m not using)
but I cannot figure it out.
Here’s the most relevant code snippet:
def selected_bar_plot(x_range, y_range):
    if x_range:
        tmp = df[(df.x > x_range[0]) & (df.x < x_range[1]) & (df.y > y_range[0]) & (df.y < y_range[1])]
    else:
        tmp = df
    counts = tmp.groupby("ShipType").count()
    counts = counts.reset_index()
    n_all = counts.MMSI.sum()
    n_max = counts.MMSI.max()
    return counts.hvplot.bar(title=f"{n_max} records", x="ShipType", y='MMSI', width=400, height=400, rot=90, color="ShipType", colormap="Category20", ylim=(0,n_max))

map_plot = df.hvplot.scatter(title=f"AIS", x='x', y='y', c="ShipType", width=700, height=400, colormap="Category20")
rangexy = hv.streams.RangeXY(source=map_plot)

map_plot + hv.DynamicMap(selected_bar_plot, streams=[rangexy])
For the full notebook, please see: https://github.com/movingpandas/movingpandas-examples/blob/main/3-tech-demos/linked-brushing.ipynb
As you can see in the following examples: both axes remain unchanged while the title and the legend update. Actually, the legend and the x axis even get out of sync.
