Hi, I am learning to use Panels, Holoviews and Bokeh - all really interesting tools! I would like to generate a Panel pipeline stage, where a heat map is displayed. I would like users to be able to click on a particular i/j location of this heat map, and have the value of the underlying data at this i/j location increment upwards by 1 (both in the underlying data, and it’s visualization on the heatmap (the application, if successful, would help users develop their own climate change vulnerability matrix). My first attempt to enable this interactivity is to embed a Holoviews Heatmap in a DynamicMap (within a Panel Pipeline class). Does this sound like the right approach? Suggestions welcome! Please ask if more info needed. My code is spaghetti and not working, so I’m not sure it’s worth sharing at this stage, but happy to do so if needed.
Have you looked at this example here? Heatmap tap — HoloViews
it sounds like the functionality you need 
Hi @JeremyFyke
Here is another example. It’s a bit slow because it has to redraw the whole plot and there is a lot of data points. I hope you would either be using a smaller dataset or that someone else in the community can help speed this up.
You can serve the app using panel serve name_of_script.py.
import hvplot.xarray
import xarray as xr
import holoviews as hv
import numpy as np
import panel as pn

pn.extension("terminal", sizing_mode="stretch_width")
hv.extension("bokeh")

DATA = "climatology-tas-annual-mean_cmip5_annual_all-regridded-bct-rcp60-climatology_median_2020-2039.nc"

data = xr.open_dataset(DATA)

climate_map = data["climatology-tas-annual-mean"].hvplot.heatmap(
    x="lon", y="lat", C="climatology-tas-annual-mean", cmap="RdBu_r"
)

points = hv.Points([])

stream = hv.streams.Tap(source=points, x=np.nan, y=np.nan)

log = pn.widgets.Terminal(height=100)


def increment_map(lon=None, lat=None, increment=10):
    if lon and lat and not np.isnan(lon) and not np.isnan(lat):
        lon = round(lon,0)
        lat = round(lat,0)
        temp0 = float(data["climatology-tas-annual-mean"].loc[{"lon": lon, "lat": lat}])
        data["climatology-tas-annual-mean"].loc[{"lon": lon, "lat": lat}] += increment
        temp1 = float(data["climatology-tas-annual-mean"].loc[{"lon": lon, "lat": lat}])
        val = f"""{lon=}, {lat=}, {temp0=}, {temp1=}\n"""
        log.write(val)

    return (
        data["climatology-tas-annual-mean"]
        .isel(time=0)
        .hvplot.heatmap(
            x="lon",
            y="lat",
            C="climatology-tas-annual-mean",
            cmap="RdBu_r",
            framewise=False,
            responsive=True,
        )
    )


# increment_map(lat=50.0, lon=50.0, increment=0.01)  # just to test the function works

increment_map = pn.bind(increment_map, lon=stream.param.x, lat=stream.param.y)

component = hv.DynamicMap(increment_map)*points

DESCRIPTION = """# User question on HoloViz Discourse

I would like users to be able to **click on a particular i/j location of this heat map**, and **have
the value of the underlying data increment upwards**.

The application would **help users develop their own climate change vulnerability
matrix**.

How do I do this?

**CHECKOUT THE ANSWER WITH CODE ON THE HOLOVIZ DISCOURSE!**
"""
ACCENT_BASE_COLOR = "#4099da"

template = pn.template.FastListTemplate(
    site="Awesome Panel",
    title="Understanding Climate Change using Click Events",
    logo="https://panel.holoviz.org/_static/logo_stacked.png",
    header_background=ACCENT_BASE_COLOR,
    accent_base_color=ACCENT_BASE_COLOR,
    main=[DESCRIPTION, pn.panel(component, sizing_mode="stretch_both", min_height=400), log],
).servable()
The data was download from Download Data | World Bank Climate Change Knowledge Portal.
I’ve attached the data. Please note you need to change .csv to .nc.
climatology-tas-annual-mean_cmip5_annual_all-regridded-bct-rcp60-climatology_median_2020-2039.csv (307.9 KB)
By the way @JeremyFyke WELCOME to the community.
It’s always a good idea to provide something that looks like a minimum reproducible example. It will save the community time as they try to help because 1) they will understand the question better 2) they save some time finding the data, understanding the data, transforming the data, writing code etc. Furthermore you would get a more specific answer.
I would strongly, strongly recommend not using heatmap for data with two numeric axes. It adds a lot of overhead over using an image. Here’s roughly how I would do it:
DATA = "~/Downloads/climatology-tas-annual-mean_cmip5_annual_all-regridded-bct-rcp60-climatology_median_2020-2039.nc"

data = xr.open_dataset(DATA)

da = data["climatology-tas-annual-mean"].isel(time=0).copy()

def img(da, x, y):
    if not (np.isnan(x) or np.isnan(y)):
        da.loc[np.round(y), np.round(x)] += 10
    return da.hvplot.image(
        x="lon",
        y="lat",
        cmap="RdBu_r",
        responsive=True,
        min_height=400,
        data_aspect=1
    )

stream = hv.streams.Tap(x=np.nan, y=np.nan)

dyn_mesh = hv.DynamicMap(pn.bind(img, da=da, x=stream.param.x, y=stream.param.y))

def points(x, y):
    return hv.Points([(x, y)]).opts(fill_alpha=0, line_color='black', size=12)

dyn_points = hv.DynamicMap(pn.bind(points, x=stream.param.x, y=stream.param.y))

plot = dyn_mesh * dyn_points

plot
How would one know that @philippjfr besides you sharing the knowledge?
You’re right that we should state that explicitly on the heatmap reference gallery pages. However if you look at the reference gallery right now, you’ll see that heatmap and image are used for very different data and only image is explicitly listed under the gridded data section: Reference Gallery — hvPlot 0.7.2 documentation
Thanks. This was my first endeavor into xarray and this kind of data.
That said, since @JeremyFyke is asking for an example where user might increment single pixels I don’t expect there to be a particularly high resolution data so using heatmap or quadmesh where you have controls of the cell/pixel border coloring might actually be nice and the efficiency of using a single image would not be too important.
@philippjfr @Marc wow, before I even start in to implementation - - THANK YOU so much for these very thoughtful replies!
@philippjfr My matrix size will be maximum ~25x15 or so in this case, and yes I would ultimately like to control border coloring. But I will still definitely try the image approach to - at least - learn it.
@Marc - if you had seen my original horrible attempt at this functionality, you may have rethought your suggestion to post code . But yes absolutely next time I’ll post code. Thanks.
Hi,
Thanks to your help @philippjfr @Marc I have a minimal working prototype! See below. Thanks again.
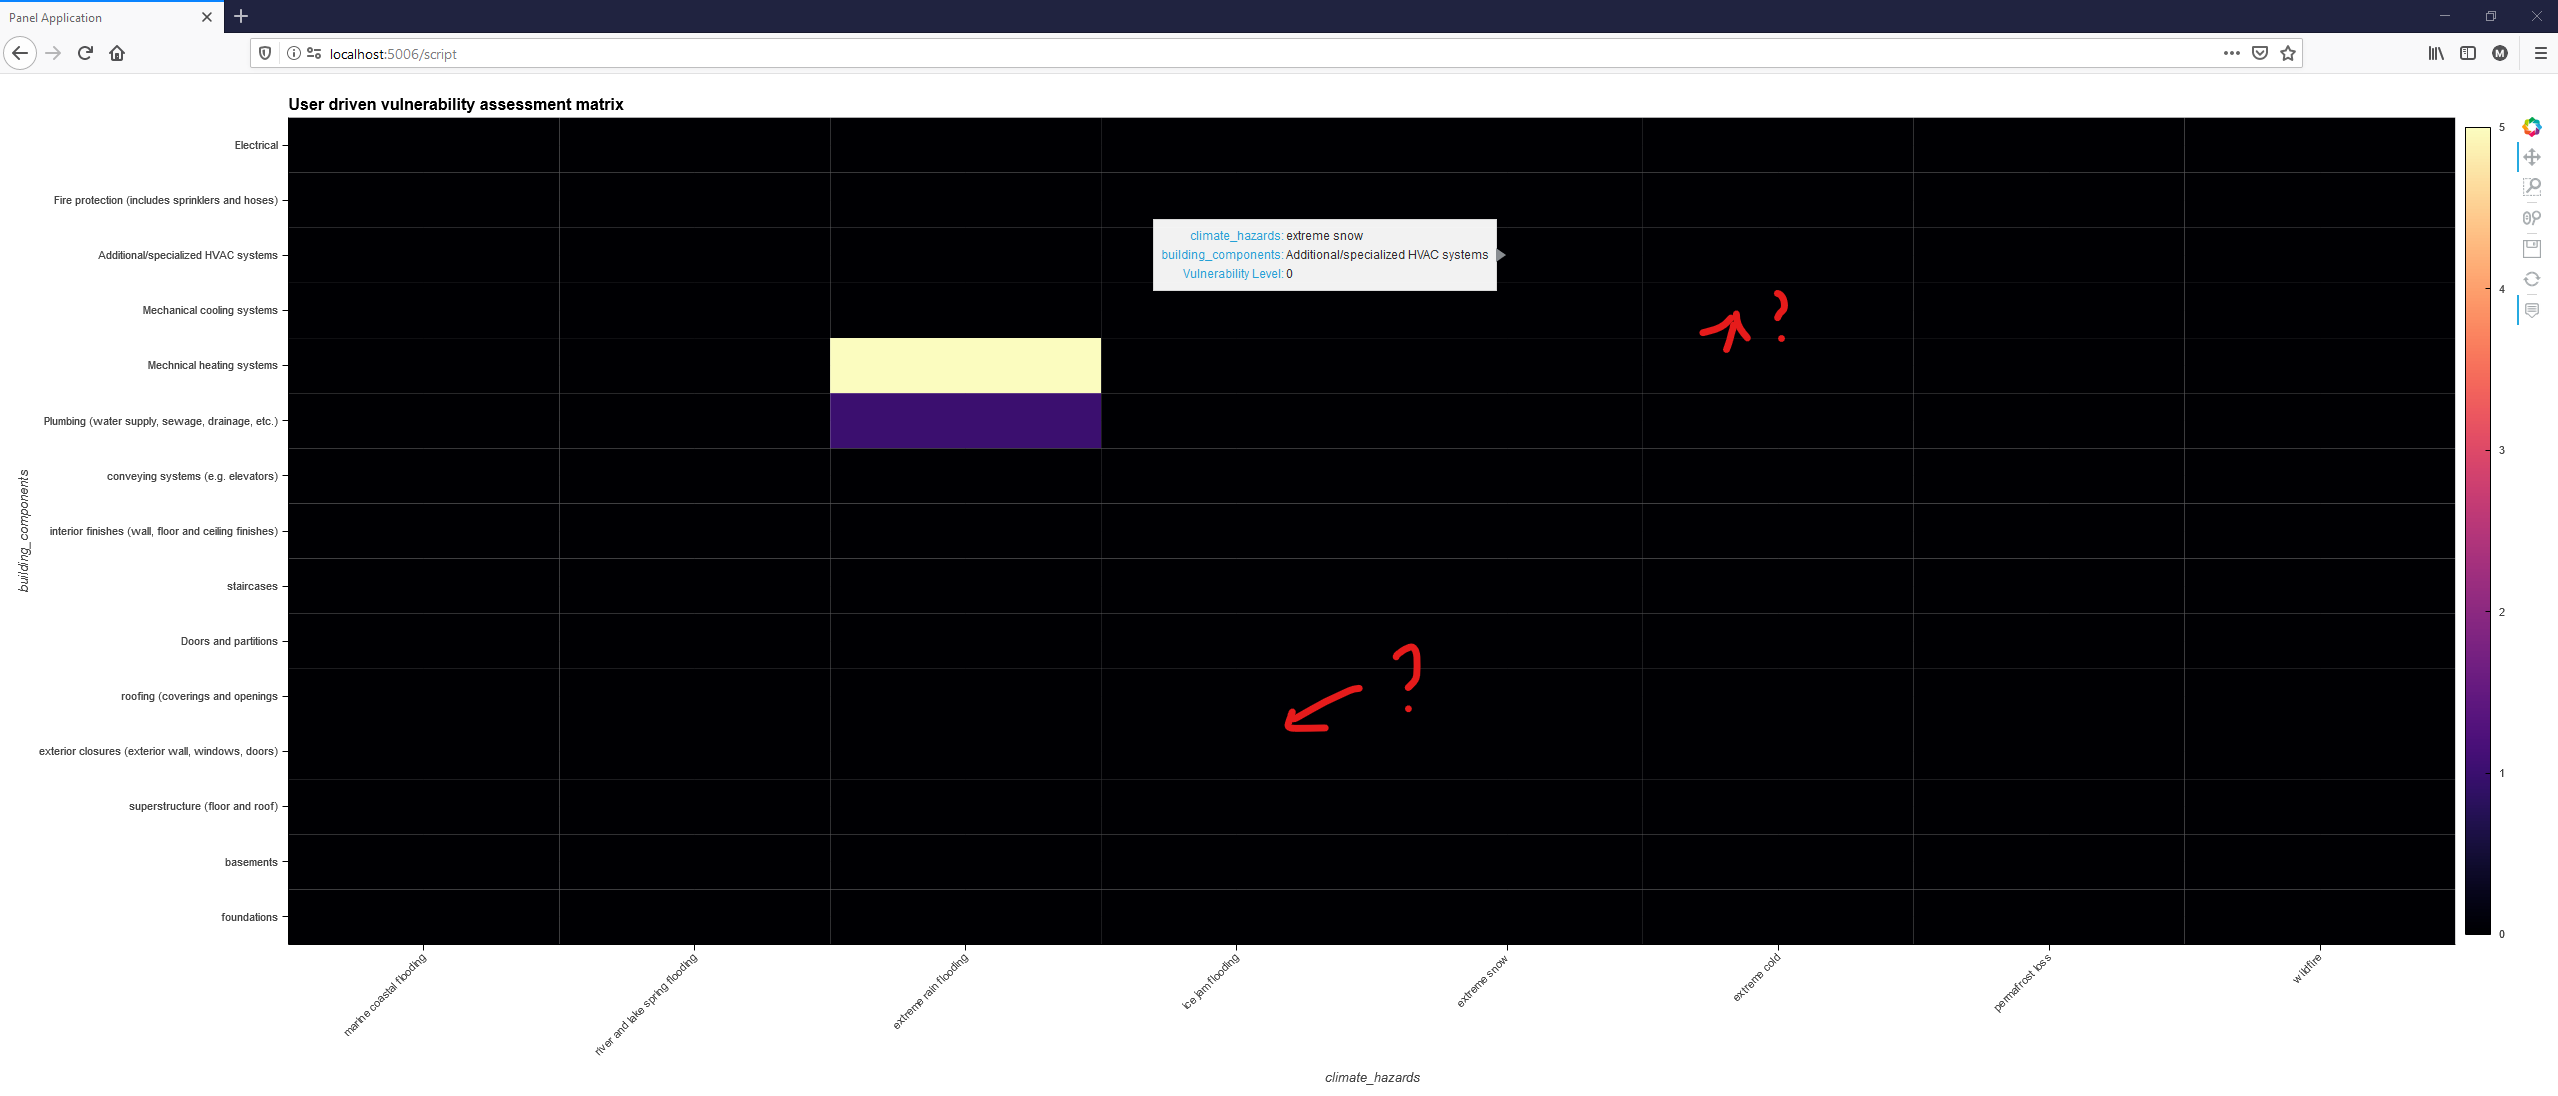
My one remaining prototype issue is that I cannot increment a given point on heatmap more than once at a time, without first moving to another heatmap point and updating that cell’s values first. For example, I can’t click point A on heatmap 3 times in a row to increase the value of point A to 3, without first clicking once on point B. I suspect this is because unless the position is perceived to change, the Tap stream does not register a new event as having occurred. Does this seem correct?
If so, suggestions to overcome?
Also, note the (categorical, small-magnitude) coordinates of the resulting heatmap. Despite being about ‘climate change’, the heatmap doesn’t actually display climate data (that’s a later step in the process).
jeremy
import panel as pn
import xarray as xr
import holoviews as hv
import hvplot.xarray
import numpy as np
hv.extension('bokeh')

building_components=["foundations",
             "basements",
             "superstructure (floor and roof)",
             "exterior closures (exterior wall, windows, doors)",
             "roofing (coverings and openings",
             "Doors and partitions",
             "staircases",
             "interior finishes (wall, floor and ceiling finishes)",
             "conveying systems (e.g. elevators)",
             "Plumbing (water supply, sewage, drainage, etc.)",
             "Mechnical heating systems",
             "Mechanical cooling systems",
             "Additional/specialized HVAC systems",
             "Fire protection (includes sprinklers and hoses)",
             "Electrical",
]

climate_hazards=["marine coastal flooding",
                 "river and lake spring flooding",
                 "extreme rain flooding",
                 "ice jam flooding",
                 "extreme snow",
                 "extreme cold",
                 "permafrost loss",
                 "wildfire",
]

dataset=xr.DataArray(np.zeros((len(climate_hazards),len(building_components))),
                     dims=['climate_hazards','building_components'],
                     coords=dict(climate_hazards=climate_hazards,building_components=building_components),
                     name='Vulnerability Level')

stream = hv.streams.Tap(x=None, y=None)

def increment_map(hazard=None,component=None):
        if hazard and component:
            dataset.loc[{"climate_hazards": hazard, "building_components": component}] += 1

        return (dataset.hvplot.heatmap(x='climate_hazards',y='building_components',C='Vulnerability Level',
                                   cmap="magma",
                                   clim=(0,5),
                                   tools=[],
                                   title="User driven vulnerability assessment matrix",
                                   rot=45,
                                   grid=True,
                                   framewise=True,
                                   responsive=True))

matrix = pn.Column(hv.DynamicMap(pn.bind(increment_map,hazard=stream.param.x, component=stream.param.y)),
                    width=1000, height=1000,
                    name='Building Component Inventory')
matrix
Hi @JeremyFyke
I think you are right regarding Taps not supporting multiple taps in the same (x,y) point. I’ve added a feature request here Support Multiple Taps for the same point · Issue #5074 · holoviz/holoviews (github.com).
A solution is to reset the stream with stream.reset().
import numpy as np
import panel as pn
import holoviews as hv
import xarray as xr
import hvplot.xarray
import param

pn.extension(sizing_mode="stretch_width")
hv.extension("bokeh")

building_components = [
    "foundations",
    "basements",
    "superstructure (floor and roof)",
    "exterior closures (exterior wall, windows, doors)",
    "roofing (coverings and openings",
    "Doors and partitions",
    "staircases",
    "interior finishes (wall, floor and ceiling finishes)",
    "conveying systems (e.g. elevators)",
    "Plumbing (water supply, sewage, drainage, etc.)",
    "Mechnical heating systems",
    "Mechanical cooling systems",
    "Additional/specialized HVAC systems",
    "Fire protection (includes sprinklers and hoses)",
    "Electrical",
]

climate_hazards = [
    "marine coastal flooding",
    "river and lake spring flooding",
    "extreme rain flooding",
    "ice jam flooding",
    "extreme snow",
    "extreme cold",
    "permafrost loss",
    "wildfire",
]

dataset = xr.DataArray(
    np.zeros((len(climate_hazards), len(building_components))),
    dims=["climate_hazards", "building_components"],
    coords=dict(climate_hazards=climate_hazards, building_components=building_components),
    name="Vulnerability Level",
)

I = 0

stream = hv.streams.Tap(x=None, y=None)

def increment_map(hazard=None, component=None):
    if hazard and component:
        dataset.loc[{"climate_hazards": hazard, "building_components": component}] += 1

        stream.reset()
        print("update", dataset.loc[{"climate_hazards": hazard, "building_components": component}].values)

    global I;I+=1;print("updates", I)

    return dataset.hvplot.heatmap(
        x="climate_hazards",
        y="building_components",
        C="Vulnerability Level",
        cmap="magma",
        clim=(0, 5),
        tools=[],
        title="User driven vulnerability assessment matrix",
        rot=45,
        grid=True,
        framewise=True,
        min_height=1000,
        responsive=True,
    )

component = hv.DynamicMap(pn.bind(increment_map, hazard=stream.param.x, component=stream.param.y))

matrix = pn.Column(
    component,
    height=1000,
    name="Building Component Inventory",
)

matrix.servable()
A few notes on improvements I was thinking about while playing around
Double Updating
As you can see the increment_map gets called twice. It might not matter for performance in this example. But for larger examples it matters. I think a lot of workarounds could be found.
I tried replacing stream.reset() with
with param.discard_events(stream):
            stream.reset()
but it did not change anything.
Discrete colormap/ colorbar.
I would make the colormap/ colorbar discrete to be able to better relate to the color increments.
Border lines “missing”
I wonder why the border lines look like they do and if it can be improved. I guess making them a bit wider could solve the issue.
UPDATE: Use .opts(line_width=1, line_color="gray") to get nicer border lines.
How do I decrement a value
I could it would be nice with the possibility to decrement a value? Especially with something like SHIFT+Click. Instead I think some toggle widget is needed to support this.
I fixed the too many updates issue via a special class
class Update(param.Parameterized):
    updates = param.Integer()
that will trigger the update of the chart instead.
import numpy as np
import panel as pn
import holoviews as hv
import xarray as xr
import hvplot.xarray
import param

pn.extension(sizing_mode="stretch_width")
hv.extension("bokeh")

building_components = [
    "foundations",
    "basements",
    "superstructure (floor and roof)",
    "exterior closures (exterior wall, windows, doors)",
    "roofing (coverings and openings",
    "Doors and partitions",
    "staircases",
    "interior finishes (wall, floor and ceiling finishes)",
    "conveying systems (e.g. elevators)",
    "Plumbing (water supply, sewage, drainage, etc.)",
    "Mechnical heating systems",
    "Mechanical cooling systems",
    "Additional/specialized HVAC systems",
    "Fire protection (includes sprinklers and hoses)",
    "Electrical",
]

climate_hazards = [
    "marine coastal flooding",
    "river and lake spring flooding",
    "extreme rain flooding",
    "ice jam flooding",
    "extreme snow",
    "extreme cold",
    "permafrost loss",
    "wildfire",
]

dataset = xr.DataArray(
    np.zeros((len(climate_hazards), len(building_components))),
    dims=["climate_hazards", "building_components"],
    coords=dict(climate_hazards=climate_hazards, building_components=building_components),
    name="Vulnerability Level",
)

points = hv.Points([])
stream = hv.streams.Tap(source=points, x=None, y=None)
increment = pn.widgets.Checkbox(value=True, name="Increment")
reset = pn.widgets.Button(name="Reset")


class Update(param.Parameterized):
    updates = param.Integer()


update = Update()


def reset_dataset(event):
    dataset[:, :] = 0
    print("resets", update.updates + 1)
    update.updates += 1


reset.on_click(reset_dataset)


def increment_dataset(hazard=None, component=None):
    if hazard and component:
        if increment.value:
            inc = 1
        else:
            inc = -1

        value = float(
            dataset.loc[{"climate_hazards": hazard, "building_components": component}].values
        )
        value += inc
        value = max(min(value, 5.0), 0.0)
        dataset.loc[{"climate_hazards": hazard, "building_components": component}] = value
        stream.reset()
        print("increments", hazard, component, update.updates + 1)
        update.updates += 1


pn.bind(increment_dataset, hazard=stream.param.x, component=stream.param.y, watch=True)


def get_heatmap(updates):
    print("update", updates)
    return dataset.hvplot.heatmap(
        x="climate_hazards",
        y="building_components",
        C="Vulnerability Level",
        cmap=["#ffffff", "#ebf4fb", "#c5e0f3", "#9fccec", "#79b7e5", "#4099da"],
        clim=(0, 5),
        tools=[],
        title="User driven vulnerability assessment matrix",
        rot=45,
        grid=True,
        framewise=True,
        min_height=600,
        responsive=True,
    ).opts(line_width=1, line_color="gray")


get_heatmap = pn.bind(get_heatmap, updates=update.param.updates)


def vulnerability(updates):
    return f"# Dummy Vulnerability Score: {int(dataset.sum())}"


vulnerability = pn.bind(vulnerability, updates=update.param.updates)

component = pn.Column(
    pn.panel(hv.DynamicMap(get_heatmap) * points, sizing_mode="stretch_both"),
    vulnerability,
    pn.Row(reset, increment, sizing_mode="fixed", width=200),
    min_height=600,
    sizing_mode="stretch_both",
    name="Building Component Inventory",
)

ACCENT_BASE_COLOR = "#4099da"

template = pn.template.FastListTemplate(
    site="Awesome Panel",
    title="User driven vulnerability assessment matrix",
    logo="https://panel.holoviz.org/_static/logo_stacked.png",
    header_background=ACCENT_BASE_COLOR,
    accent_base_color=ACCENT_BASE_COLOR,
    main=[component],
).servable()
Hi @Marc and @philippjfr - thanks again for all help here!
I’ve had a chance to do some more work, and happy to present a working (but very laggy!) Mybinder-based prototype that includes the heatmap stuff you helped me with. Certainly still a work in progress, but I think that at least it demonstrates that Panel (etc.) is able to give me the necessary interactivity that I need for my project.
Aside from your heatmap work, this definitely benefited from Panel documentation here: A high-level app and dashboarding solution for Python — Panel 0.12.3 documentation
Thanks again for the excellent help and development/documentation of these tools.
jeremy