Updating plot data with periodic callback

I am trying to update a plot at regular intervals with new data. Not streaming data record by record but a new dataset.
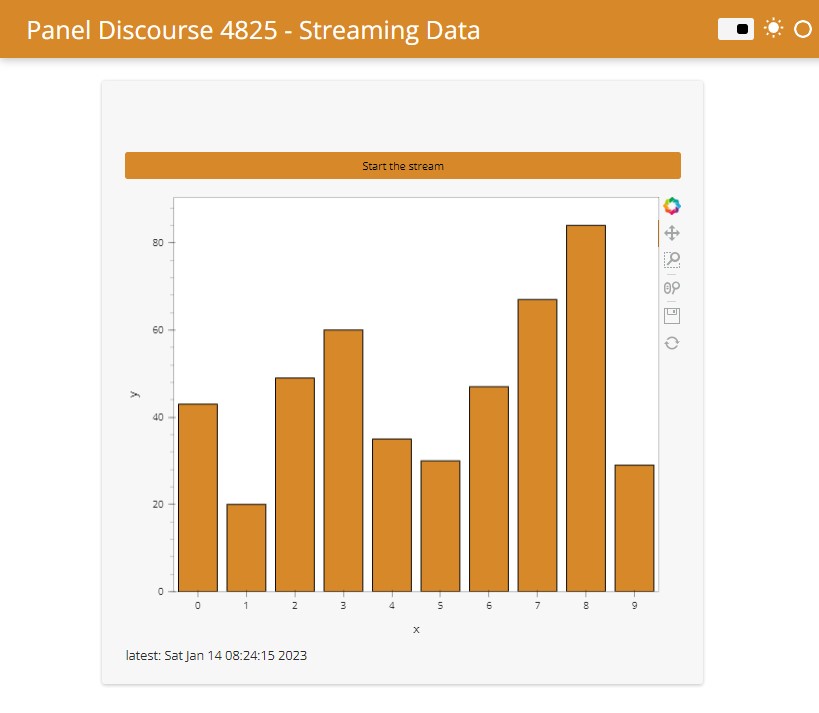
I looked at this post from Marc: Panel - starting a stream of data

Setting meta_refresh works but is not ideal for my case where the updated plot data comes from a HTTP request.

How does one update a plot within the main section of a template layout ?

Here is a short version of what I am trying to do:

import pandas as pd
import numpy as np
import hvplot.pandas
import panel as pn
import datetime

# status bar
latest_update = pn.widgets.StaticText()

# generate plot
def get_plot():
    df = pd.DataFrame(np.random.randint(
        0, 100, size=(15, 4)), columns=list('ABCD'))
    return df.hvplot.barh('A', 'C', height=300, width=500,)

# callback to update plot
def update_plot():
    latest_update.value = f'updating: {datetime.datetime.now().strftime("%c")}'
    # in practice this will take a while
    new_plot = get_plot()
    # this does not work...
    template.main.objects[0] = pn.pane.HoloViews(new_plot)
    latest_update.value = f'latest: {datetime.datetime.now().strftime("%c")}'

# initiate periodic callback
pn.state.add_periodic_callback(update_plot, period=10000, start=True)

# initial plot
plot = get_plot()
latest_update.value = f'latest: {datetime.datetime.now().strftime("%c")}'

# template setup
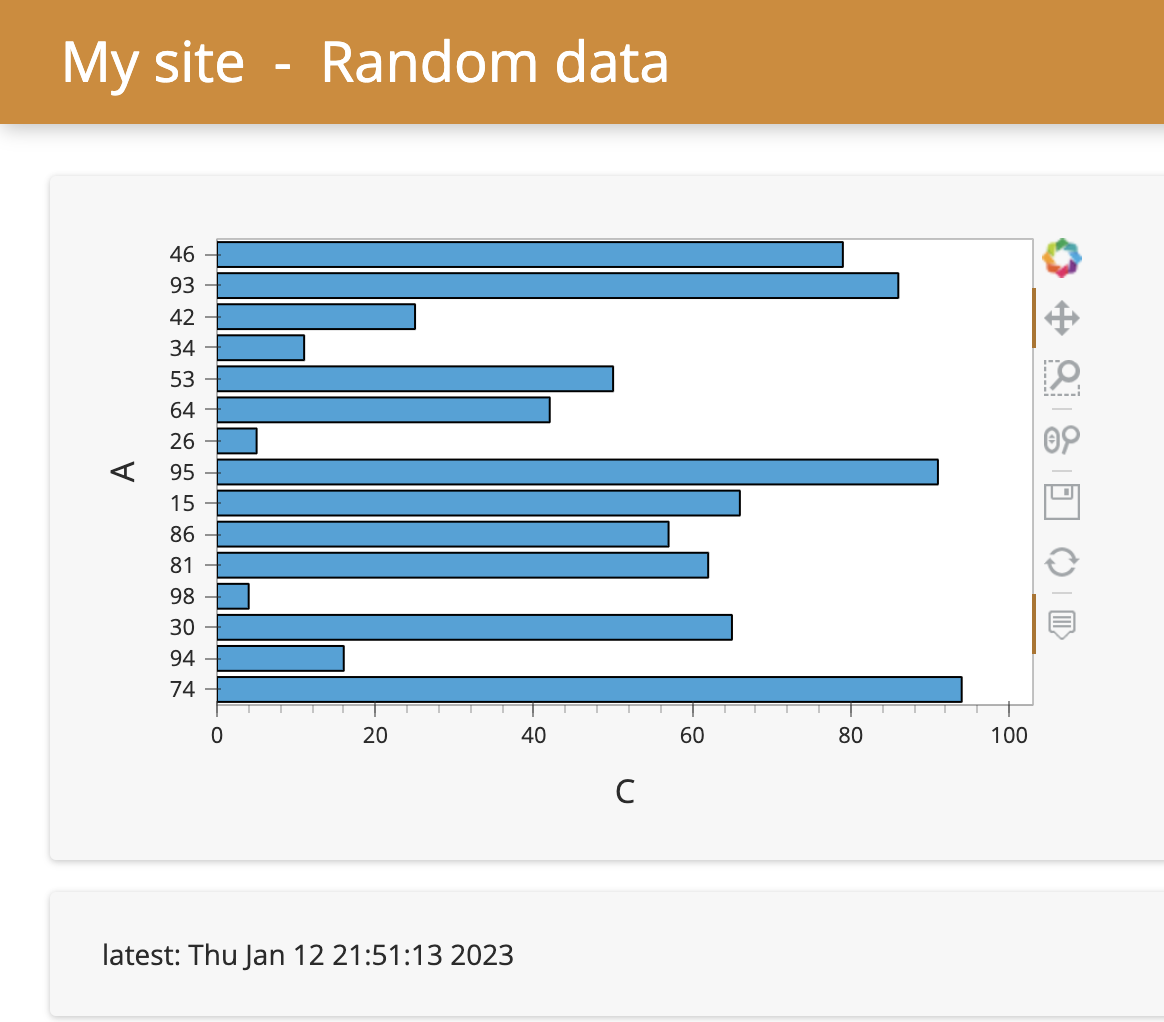
template = pn.template.FastListTemplate(
    site="My site",
    title="Random data",
    accent_base_color='#d78929',
    header_background='#d78929',
    main=[plot, latest_update,],
    # meta_refresh="10",
).servable()

Hi

Just given you some idea here:

import pandas as pd
import numpy as np
import random
import panel as pn
import datetime as dt
import holoviews as hv
import time
from holoviews.streams import Pipe
hv.extension('bokeh')
pn.extension()


latest_update = pn.widgets.StaticText()

# define a pip funtionn for streams the data
pipe = Pipe(data=[])
dmap = hv.DynamicMap(hv.Bars, streams=[pipe])

# init the data 
x,y = [x for x in range(10)],[random.randint(0,100) for y in range(10)]
pipe.send((x,y)) 

# define the update funtion
def update_plot():
    latest_update.value = f'updating: {dt.datetime.now().strftime("%c")}'
    time.sleep(0.5)
    x,y = [x for x in range(10)],[random.randint(0,100) for y in range(10)]
    pipe.send((x,y)) 
    latest_update.value = f'latest: {dt.datetime.now().strftime("%c")}'
# period call back
cb = pn.state.add_periodic_callback(update_plot, period=2000, start=False)    

# define the start and stop button
button = pn.widgets.Button(name = 'Click to Start', button_type = 'success')
def button_click(event):
    if button.name == 'Click to Start':
        print('started')
        cb.start()
        button.name = 'started'
        button.button_type = 'danger'
    else:
        print('stoped')
        cb.stop()
        button.name ='Click to Start'
        button.button_type = 'success'
button.on_click(button_click)

# layout
pn.Column(
    button,
    pn.Column(
        dmap
    ),
    latest_update
)

Here is some link learn about stream data:Working with Streaming Data — HoloViews v1.15.3

Kind regards
Victor

2 Likes

Perfect ! Works flawlessly.
Thank you

Hi @sylvaint and others

You can find the live app at awesome-panel

App: Panel Application
Code: https://awesome-panel.org/sharing?app=MarcSkovMadsen/discourse-4825-streaming-data

app

2 Likes