When specifying hover_cols with a list everything works fine.
import pandas as pd
import numpy as np
import hvplot.pandas
n=100
df = pd.DataFrame(index=range(n),data=dict(value=np.random.random(n),tip=np.random.random(n)))
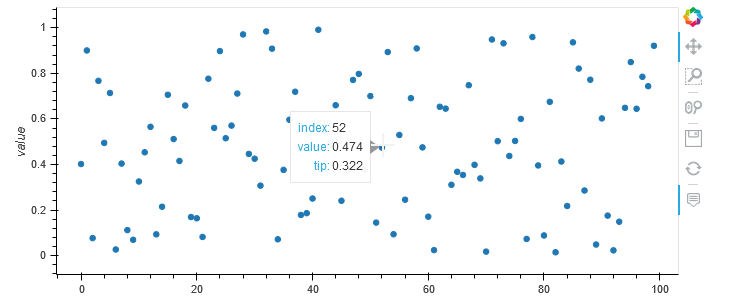
df.hvplot.scatter(y='value',hover_cols=['tip'])
But when I mistakenly added only a single string…
df.hvplot.scatter(y='value',hover_cols='tip')
hvplot returns an incomprehensible and misleading AttributeError.
---------------------------------------------------------------------------
AttributeError                            Traceback (most recent call last)
<ipython-input-42-823a146127eb> in <module>
----> 1 df.hvplot.scatter(y='value',hover_cols='tip')

~\AppData\Local\Continuum\anaconda3\envs\data-37\lib\site-packages\hvplot\plotting\core.py in scatter(self, x, y, **kwds)
    189             The HoloViews representation of the plot.
    190         """
--> 191         return self(x, y, kind='scatter', **kwds)
    192
    193     def area(self, x=None, y=None, y2=None, stacked=True, **kwds):

~\AppData\Local\Continuum\anaconda3\envs\data-37\lib\site-packages\hvplot\plotting\core.py in __call__(self, x, y, kind, **kwds)
     70                 return pn.panel(plot, **panel_dict)
     71
---> 72         return self._get_converter(x, y, kind, **kwds)(kind, x, y)
     73
     74     def _get_converter(self, x=None, y=None, kind=None, **kwds):

~\AppData\Local\Continuum\anaconda3\envs\data-37\lib\site-packages\hvplot\converter.py in __call__(self, kind, x, y)
    942                 obj = DynamicMap(cbcallable, streams=[self.stream])
    943             else:
--> 944                 obj = method(x, y)
    945
    946         if self.crs and self.project:

~\AppData\Local\Continuum\anaconda3\envs\data-37\lib\site-packages\hvplot\converter.py in scatter(self, x, y, data)
   1235
   1236     def scatter(self, x=None, y=None, data=None):
-> 1237         return self.chart(Scatter, x, y, data)
   1238
   1239     def area(self, x=None, y=None, data=None):

~\AppData\Local\Continuum\anaconda3\envs\data-37\lib\site-packages\hvplot\converter.py in chart(self, element, x, y, data)
   1202     def chart(self, element, x, y, data=None):
   1203         "Helper method for simple x vs. y charts"
-> 1204         data, x, y = self._process_chart_args(data, x, y)
   1205         if x and y and not isinstance(y, (list, tuple)):
   1206             return self.single_chart(element, x, y, data)

~\AppData\Local\Continuum\anaconda3\envs\data-37\lib\site-packages\hvplot\converter.py in _process_chart_args(self, data, x, y, single_y)
   1184
   1185         # set index to column if needed in hover_cols
-> 1186         if self.use_index and any(c for c in self.hover_cols if
   1187                                   c in self.indexes and
   1188                                   c not in data.columns):

AttributeError: 'HoloViewsConverter' object has no attribute 'hover_cols'
How does hvplot suddenly not recognise hover_cols anymore?