Hi everybody
I´m using holoviews in some applications in logs of oil and gas wells. (1D data)
Holoviews element curve is very useful for this purpose.
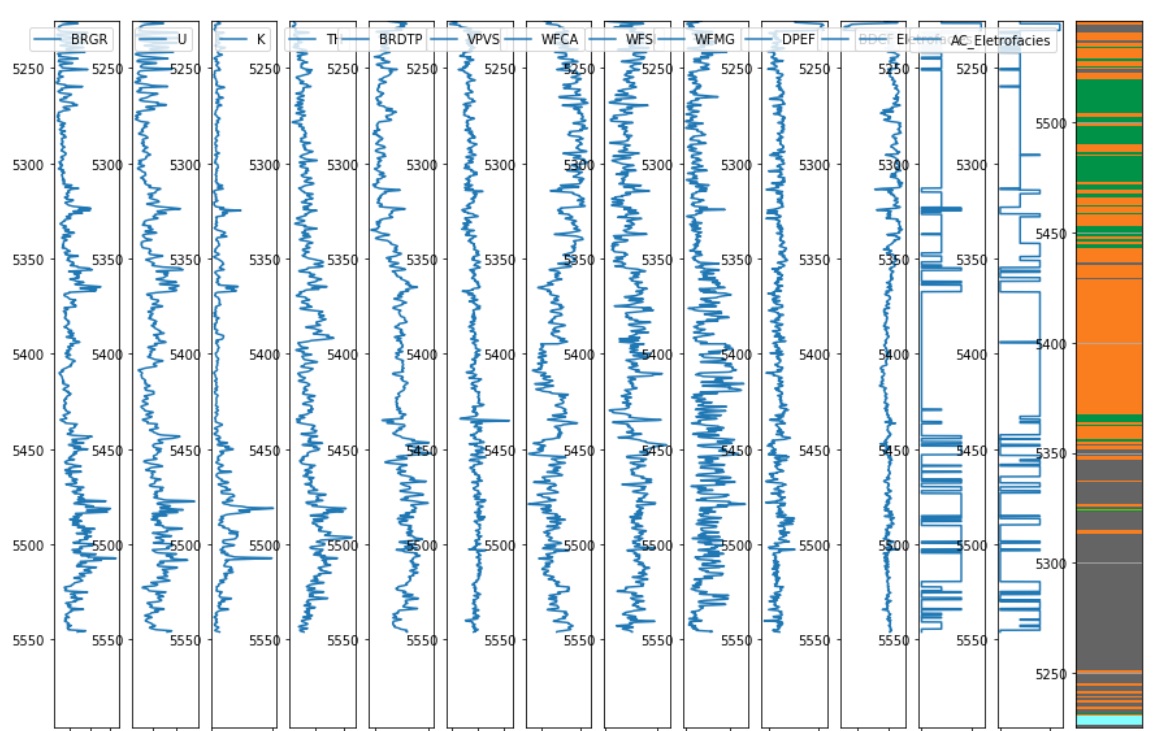
In the image below, the curves are representing physical properties of the oil and gas reservoirs (horizontal axis) through the well depths (vertical axis).
Now I need to represent discrete classes( for ex. 1, 2, 3 , 4 or A, B, C, D) along the vertical axis with colors (each discrete value with one different color). Just like the example in the picture below:
I don´t know how to do this. Which is the best element to be created in Holoviews.
My database is a DataFrame in which I have a column with depths values, others columns with well logs values (I generated the curves using this with Depths), and this other column with the discrete classes (which I want to colored along the depths)
I´ve tried Image, Rectangle, Polygons (but need 2D data)
Anyone have any idea?