Here is a copy of a file called “sample.csv” to demonstrate the issue I’m describing.
timestamp,location,cavity-confidence,fault-type-confidence,llrf
10/9/2022 6:52,2L22,0.73,0.54,new llrf
10/9/2022 6:36,2L22,0.84,0.73,new llrf
10/9/2022 3:39,2L26,0.49,0.47,new llrf
10/9/2022 2:36,1L23,0.25,0.2,old llrf
10/9/2022 2:36,1L23,0.1,0.3,old llrf
10/9/2022 2:36,1L23,0.3,0.1,old llrf
10/9/2022 2:35,1L23,0.99,0.96,old llrf
10/9/2022 2:20,1L23,0.25,0.25,old llrf
10/9/2022 2:20,1L23,0.99,0.99,old llrf
10/9/2022 1:51,1L24,0.4,0.2,old llrf
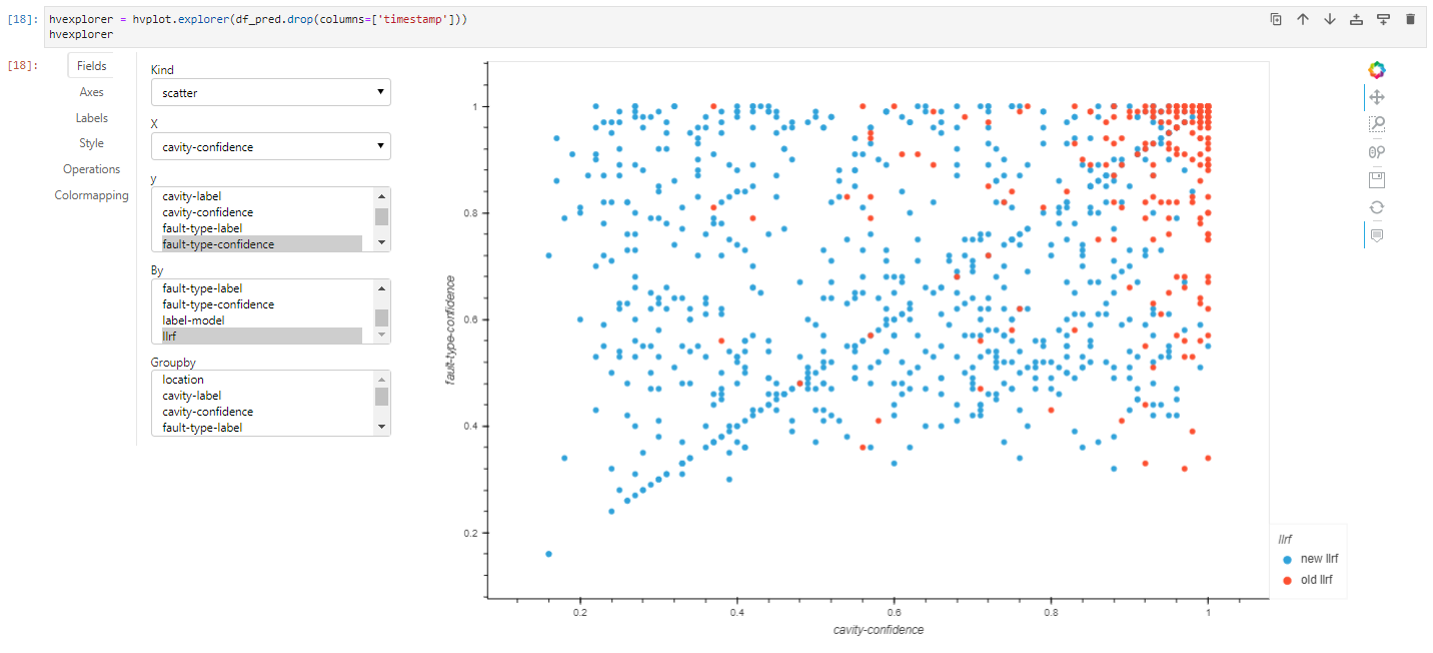
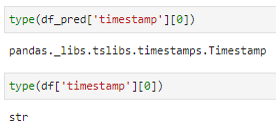
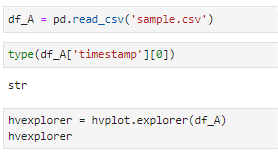
If you simply read in the .csv with no modifications, the timestamp will be interpreted as a string. Using hvplot.explorer works in this instance (i.e. you can plot a variable against the timestamp, even if the timestamp is not in chronological order). You can reproduce this using the commands below:
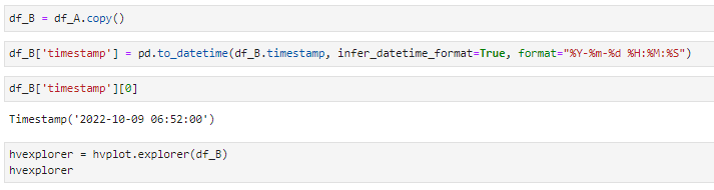
However, if you change the timestamp to a Pandas timestamp object - to get functionality that is not possible with a string - and then trying to use hvplot.explorer, it will not work. You can reproduce that result using the commands below:
I then get the following error: