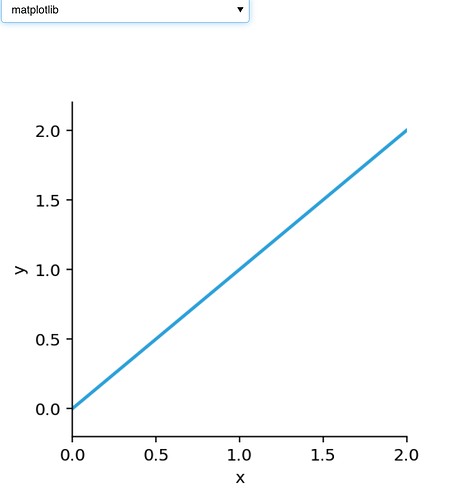
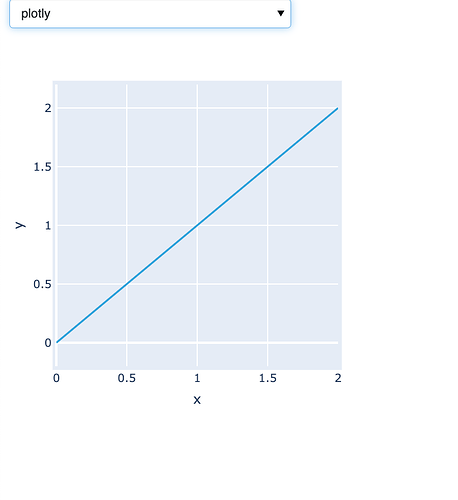
How can I dynamically change the renderer via a widget. I remember seeing that in a tutorial, but I can’t find it anymore. Anyone has a reference for that? I have tried the following but it did not work:
view = param.rx(hvplot.render)(view, backend=backend_widget)
Are you running it in a notebook?
import holoviews as hv
import panel as pn

def render(plot, backend):
    hv.extension(backend)
    output = pn.panel(hv.render(plot, backend=backend))
    return output


curve = hv.Curve([0, 1, 2])
select = pn.widgets.Select(options=["matplotlib", "bokeh", "plotly"])
pn.Column(
    select,
    pn.bind(render, curve, select.param.value)
).show()
This seems to work if its served on the browser
Your example indeed works, but if I add a few more indirections it starts to fail. Here is an example of the backend that I want and where it fails:
import holoviews
import panel
import param
import dataclasses

from panel.layout import Panel

holoviews.extension("bokeh", "matplotlib")
backend = panel.widgets.Select(options=["matplotlib", "bokeh"])

@dataclasses.dataclass
class Plotter:
    backend: panel.widgets.Select

    def view(self, view: param.rx | holoviews.Element) -> Panel:
        widgets = panel.WidgetBox()
        widgets.insert(0, self.backend)
        # view = param.rx(hvplot.render)(view, backend=self.backend)
        view = param.rx(holoviews.render)(view, backend=self.backend)
        widgets += panel.ReactiveExpr(view).widgets
        view_item = panel.ReactiveExpr(view, show_widgets=False)
        return panel.Row(widgets, view_item)

plot = Plotter(backend)
curve = holoviews.Curve([0, 1, 2])
plot.view(curve)
Using param.rx in your example still works, so it’s somewhere in the middle of that where it starts to fail. I’ll try to hunt it down a bit more
I have narrowed down the issue being the widgets += panel.ReactiveExpr(view).widgets. Interestingly this works around it:
        for widget in view_item.widgets:
            if widget == self.backend:
                continue
            widgets.append(widget)
Well there is another issue with using holoviews.render, when I backend specific options, e.g. line_dash vs linestyle, I get issues of “linestyle option not found for line plot with bokeh”

