Using Param with Panel breaks my chart

Hi,
I’m new to Holoviz and I’m creating a proof of concept for real-time data analysis.
I’ve been able to stream my data to a real-time chart, and I would like to add some parameters (subtract two curves, and add an offset to a curve) for the user to interact with the chart.

To do so, I used a param.Parameterized class. The subtraction works, but when I change the curve to subtract with my param.ObjectSelector widget, then the chart breaks: at first the refreshing is “throttled” (the total cpu usage is barely 60-70% with 15% from the web navigator though) while the auto-range breaks and the curves disapear slowly leaving an empty chart.
I created my Panel app as follow:

import asyncio
import panel as pn, holoviews as hv 
from utils.Frequencemetre import Frequencemetre

pn.config.sizing_mode = 'stretch_width'
hv.extension('bokeh')

frequencemetre = Frequencemetre()

pn.template.FastListTemplate(
    site="Panel", 
    title="PoC", 
    sidebar=[*controls], 
    main=[
        pn.Row(frequencemetre.view,frequencemetre.param)       
    ]
).servable();

And my Frequencemetre class is as follow:

import param
import redis
import json

import holoviews as hv 
import pandas as pd, numpy as np
from holoviews.streams import Buffer

from tornado.ioloop import PeriodicCallback
from tornado import gen

class Frequencemetre(param.Parameterized):
    # left side of the subtraction
    c1 = param.ObjectSelector(
        default="Channel 1", 
        objects=["N/A", "Channel 1", "Channel 2", "Channel 3", "Channel 4"]
    )
    # right side of the subtraction
    c2 = param.ObjectSelector(
        default="Channel 2", 
        objects=["N/A", "Channel 1", "Channel 2", "Channel 3", "Channel 4"]
    )
    # my offset
    offset = param.Number(0.0, precedence=0)
        
    # I get my real time data from a Redis cache
    r = redis.Redis()

    df = pd.DataFrame({
                       'timestamp': np.array([]),
                       'var_0': np.array([]),
                       'var_1': np.array([]),
                       'var_2': np.array([]),
                       'var_3': np.array([]),
                       'var_4': np.array([]),
                       'var_5': np.array([]),
                       'var_6': np.array([]),
                       'var_7': np.array([])})
    df.set_index('timestamp', inplace=True)

    # this is the buffer containing my data
    buffer = Buffer(data=df, length=1000)
    
    # This function is called from my hv.DynamicMap and plots 8 curves
    @param.depends('c1', 'c2', 'offset')
    def sin_curves(self,data):
        # I apply my transformation here, on the 8th curve, not elegant but I don't know if there's a better way
        data["var_7"] = data["var_" + str(self.c1[-1])] - data["var_" + str(self.c2[-1])] + self.offset
        return ( 
            hv.Curve(data[["timestamp","var_0"]], label='Variable 0') *
            hv.Curve(data[["timestamp","var_1"]], label='Variable 1') * 
            hv.Curve(data[["timestamp","var_2"]], label='Variable 2') *
            hv.Curve(data[["timestamp","var_3"]], label='Variable 3') *
            hv.Curve(data[["timestamp","var_4"]], label='Variable 4') * 
            hv.Curve(data[["timestamp","var_5"]], label='Variable 5') *
            hv.Curve(data[["timestamp","var_6"]], label='Variable 6') *
            hv.Curve(data[["timestamp","var_7"]], label='Variable 7')
            )
     
     # This is the function fetching the data
    @gen.coroutine
    def sin_data(self):
        # Read the last element from the Redis list
        data = self.r.lindex('random_sin', -1)
        if data:
            data = json.loads(data)
            index = pd.to_datetime(data['timestamp'], unit='ms')
            self.buffer.send(pd.DataFrame({
                               'timestamp': [index],
                               'var_0': [data['var_0']],
                               'var_1': [data['var_1']],
                               'var_2': [data['var_2']],
                               'var_3': [data['var_3']],
                               'var_4': [data['var_4']],
                               'var_5': [data['var_5']],
                               'var_6': [data['var_6']],
                               'var_7': [data['var_7']]}))

    # Here is my function used to display the DynamicMap, as showed in the example
    def view(self):
        PeriodicCallback(self.sin_data, 100).start()
        return hv.DynamicMap(self.sin_curves ,streams=[self.buffer]).opts(
             width=1200, 
             height=600,
             title='Sinusoides',
             tools=['hover']
        )

Is this the correct way to parameterize a real-time chart?
Custom Operations seemed promising but I had some trouble trying to add kdims to my DynamicMap to create the widgets, even with functools.partial.

Thanks in advance!
1 Like

Hi @mehdi

You almost gave me a shock. I read your title as Using Param with Panel breaks my heart :smile:

I think you have many good things going in your example. The main thing to consider is make sure that you periodically read the data from redis only once for your entire application instead of once for each open user session. If you read data per user it could get slow.

You probably also want to set the length of your buffer to not end up moving too many points around and displaying them. That would also be slow and could lead to a risk of crashing your browser.

So in my example below I have created a seperate SharedBuffer class that is shared among all user sessions.

app.py

import panel as pn, holoviews as hv 
from frequencemetre import SharedBuffer, Frequencemetre

pn.extension(sizing_mode = 'stretch_width')
hv.extension('bokeh')

ACCENT="#A01346"

# We will share the buffer instance among all users/ sessions
# to avoid having lots of instances all reading data from the redis cache
shared_buffer = pn.state.as_cached("shared_buffer", SharedBuffer)

frequencemetre = Frequencemetre(buffer=shared_buffer)

pn.template.FastListTemplate(
    site="Panel", 
    title="Streaming Frequency Metre PoC",
    accent_base_color=ACCENT, header_background=ACCENT,
    main=[
        pn.Row(frequencemetre.view,pn.panel(frequencemetre.param, width=150))       
    ]
).servable()

frequencemetre.py

import holoviews as hv
import numpy as np
import pandas as pd
import param
from holoviews.streams import Buffer
from tornado import gen
from tornado.ioloop import PeriodicCallback

INITIAL_DATA = pd.DataFrame(
    {
        "timestamp": np.array([]),
        "var_0": np.array([]),
        "var_1": np.array([]),
        "var_2": np.array([]),
        "var_3": np.array([]),
        "var_4": np.array([]),
        "var_5": np.array([]),
        "var_6": np.array([]),
        "var_7": np.array([]),
    }
)
INITIAL_DATA.set_index("timestamp", inplace=True)

class SharedBuffer(param.Parameterized):
    value = param.ClassSelector(class_=Buffer)
    last_update = param.Date()

    def __init__(self, **params):
        params.update(
            value = Buffer(data=INITIAL_DATA, length=1000),
            last_update = pd.Timestamp.now(),
        )
        super().__init__(**params)
        
        PeriodicCallback(self.sin_data, 500).start()

    @gen.coroutine
    def sin_data(self):
        # Read the last element from the Redis list
        # Just do something random in this example
        N = 3
        start = self.last_update
        self.last_update = end = pd.Timestamp.now()
        index = [start + (start-end)*float(i)/float(N) for i in range(N)]
        data = pd.DataFrame(
            {
                "timestamp": index,
                "var_0": np.random.rand(N),
                "var_1": np.random.rand(N),
                "var_2": np.random.rand(N),
                "var_3": np.random.rand(N),
                "var_4": np.random.rand(N),
                "var_5": np.random.rand(N),
                "var_6": np.random.rand(N),
                "var_7": np.random.rand(N),
            }
        )
        self.value.send(data)


class Frequencemetre(param.Parameterized):
    c1 = param.ObjectSelector(
        default="Channel 1",
        objects=["Channel 1", "Channel 2", "Channel 3", "Channel 4"],
        doc="left side of the subtraction"
    )
    c2 = param.ObjectSelector(
        default="Channel 2",
        objects=["Channel 1", "Channel 2", "Channel 3", "Channel 4"],
        doc="right side of the subtraction",
    )
    offset = param.Number(0.0, precedence=0)
    buffer = param.ClassSelector(class_=SharedBuffer, precedence=-1)

    @param.depends("c1", "c2", "offset")
    def sin_curves(self, data: pd.DataFrame):
        """This function is called from my hv.DynamicMap and plots 8 curves
        I apply my transformation here, on the 8th curve, not elegant but I don't know if there's a better way"""
        data = data.sort_values(by="timestamp").tail(100)
        data["var_7"] = (
            data["var_" + str(self.c1[-1])]
            - data["var_" + str(self.c2[-1])]
            + self.offset
        )
        return (
            hv.Curve(data[["timestamp", "var_0"]], label="Variable 0")
            * hv.Curve(data[["timestamp", "var_1"]], label="Variable 1")
            * hv.Curve(data[["timestamp", "var_2"]], label="Variable 2")
            * hv.Curve(data[["timestamp", "var_3"]], label="Variable 3")
            * hv.Curve(data[["timestamp", "var_4"]], label="Variable 4")
            * hv.Curve(data[["timestamp", "var_5"]], label="Variable 5")
            * hv.Curve(data[["timestamp", "var_6"]], label="Variable 6")
            * hv.Curve(data[["timestamp", "var_7"]], label="Variable 7")
        )

    def view(self):
        return hv.DynamicMap(self.sin_curves, streams=[self.buffer.value]).opts(
            responsive=True, height=600, title="Sinusoides", tools=["hover"], legend_position='top_left'
        )
panel serve app.py

I am not an expert in using Tornado, PeriodicCallback and @gen.coroutine so whether that could be modernized using pn.state.schedule_task and async as in How to make the pn.state.schedule_task non-blocking? - Panel - HoloViz Discourse might be worth checking out. But your code works, so maybe its not worth it.

As your code example was not a minimum, reproducible example I can run I cannot say anything about the throttling and cpu usage. If you have problems with my example too, then please try to adjust my example (or similar) such that you can share it and I or others in the community can run it. We need to be able to reproduce what you experience in order to find the cause. Thanks.

1 Like

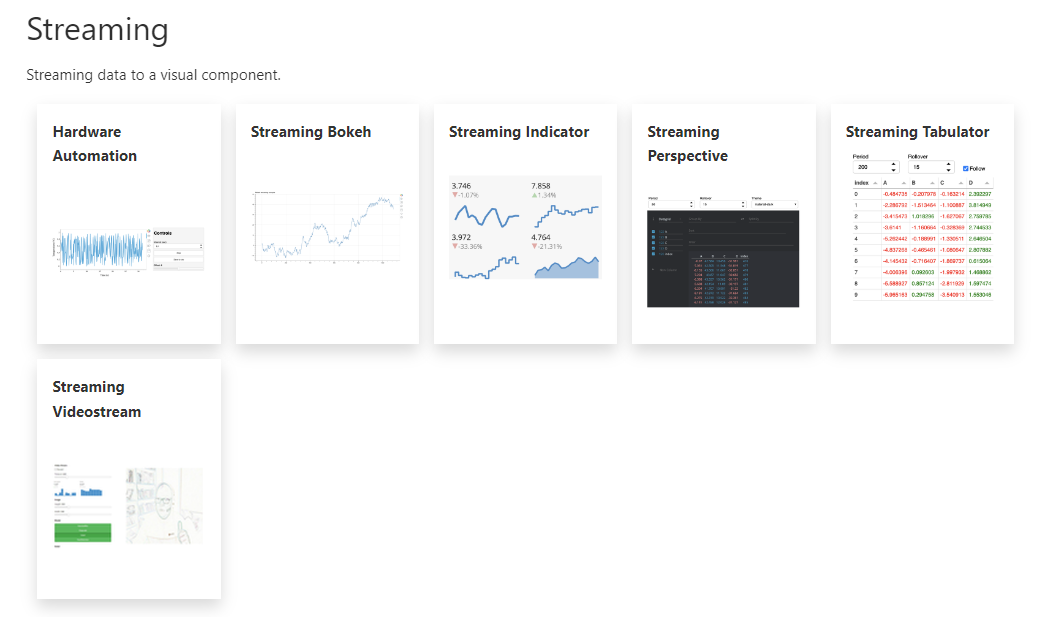
You might also find some inspiration in the Panel Streaming Gallery

image

Your example might also be a valid addition to the Gallery once polished?

1 Like

Hi @Marc,

You almost gave me a shock. I read your title as Using Param with Panel breaks my heart :smile:

But it did though, I thought it wouldn’t work :joy:

So in my example below I have created a seperate SharedBuffer class that is shared among all user sessions.

I used your code and now it works like a charm!

I am not an expert in using Tornado, PeriodicCallback and @gen.coroutine so whether that could be modernized using pn.state.schedule_task and async as in How to make the pn.state.schedule_task non-blocking? - Panel - HoloViz Discourse might be worth checking out. But your code works, so maybe its not worth it.

Interesting, I didn’t implemented it yet, but i’ll give it a try.

As your code example was not a minimum, reproducible example I can run I cannot say anything about the throttling and cpu usage.

I understand: the only part you’ll be missing is my marvellous * ahem * ChatGPT generated * ahem* API for tests.

import time
import redis
import json
import math
import random
from flask import Flask, request
import threading

app = Flask(__name__)
redis_client = redis.Redis()

NUM_DATA_POINTS = 1000
sine_params = {'freq': 1.0, 'amplitude': 1.0, 'noise_amplitude': 0.1}

def generate_data():
    while True:
        timestamp = int(time.time() * 1000)
        sine_data = {'timestamp': timestamp}
        for i in range(8):
            sine_var = 'var_{}'.format(i)
            sine_val = float(sine_params['amplitude']) * math.sin(float(sine_params['freq'] + i/5.0) * timestamp / 1000.0) + i
            sine_val += random.uniform(-sine_params['noise_amplitude'], sine_params['noise_amplitude'])
            sine_data[sine_var] = sine_val
        redis_client.rpush('random_sin', json.dumps(sine_data))

        if redis_client.llen('random_sin') >= NUM_DATA_POINTS:
            redis_client.lpop('random_sin')
        time.sleep(0.1)

@app.route('/set_sine_params', methods=['POST'])
def set_sine_params():
    data = request.get_json()
    sine_params['freq'] = data.get('freq', sine_params['freq'])
    sine_params['amplitude'] = data.get('amplitude', sine_params['amplitude'])
    sine_params['noise_amplitude'] = data.get('noise_amplitude', sine_params['noise_amplitude'])
    return 'Sine parameters updated'

if __name__ == '__main__':
    generator_thread = threading.Thread(target=generate_data)
    generator_thread.start()
    app.run()

You might also find some inspiration in the Panel Streaming Gallery

Very interesting read indeed, I didn’t dig enough to find this resource!

Your example might also be a valid addition to the Gallery once polished?

If that can be of any help, I’ll definitely do it.

And lastly, thanks for your huge support!

1 Like