I am trying to build a simple layout visualization that includes 2 plots - a heatmap and a curve
each plot has its own data source and I would like to use the coordinates from the heatmap to update the curve plot.
my (simplified) current code looks like this:
import holoviews as hv

# x, y, xy are NumPy arrays
tiles = [(x[j], y[i], xy[i, j]) for i in range(len(y)) for j in range(len(x))]   # creating a grid like list
heatmap = hv.HeatMap(tiles)

# Declare Tap stream with heatmap as the source and initial values
posxy = hv.streams.Tap(source=heatmap, x=x[0], y=0)

# create the curve plot, t and v are NumPy arrays with 1 dimention
curve = hv.Curve((t, v))

# Define function to view the relevant time series based on tap location
def tap_curve(x, y):
    curve.opts(xlim=(x, x + 10))
    return curve

# Connect the Tap stream to the tap_ts callback
tap_dmap = hv.DynamicMap(tap_ts, streams=[posxy])
layout = heatmap + tap_dmap
the resulting figure doesn’t update itself when I tap the heatmap but does visualize the curve figure with the initial values.
the figure looks like this (there is a lot of code I ommited to simplify my intentions)
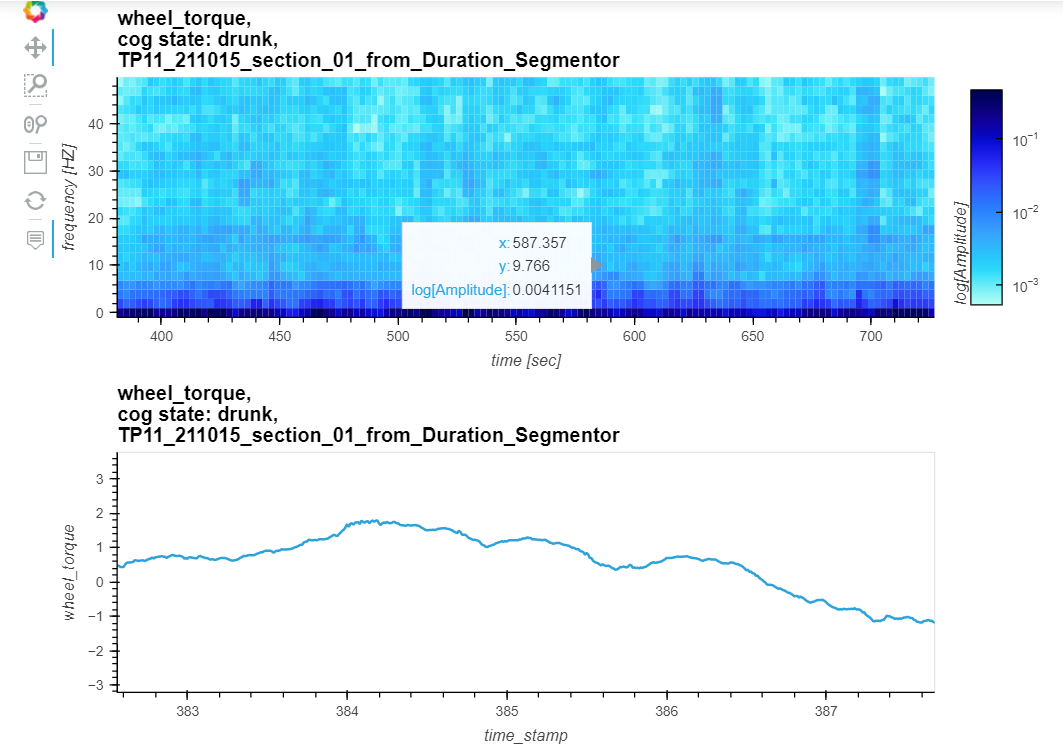
how should I define the “tap_curve” function to properly update my curve plot? or the problem is not even in this function? I tried different things but nothing seemed to work.
any help would be appreciated ![]()