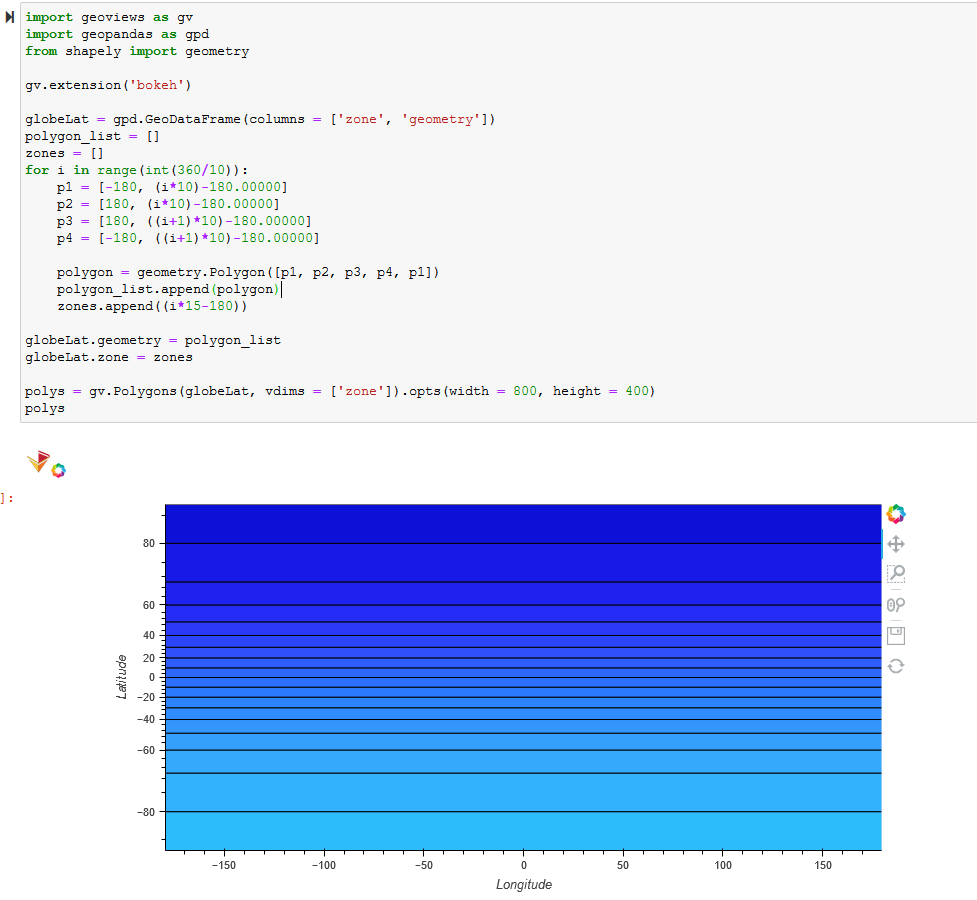
I’m attempting to create custom polygons to break up the globe based on latitude. I want to create a stripe around the globe at every 15 degrees latitude. I created a dataframe to pass to gv.Polygons() but I am getting a ValueError whenever I try. Below is my code for creating the globeLat dataframe:
globeLat = pd.DataFrame(columns = ['zone', 'geometry'])
for i in range(int(90/10)):
p1 = [-90, (i*10)-90.00000]
p2 = [90, (i*10)-90.00000]
p3 = [90, ((i+1)*10)-90.00000]
p4 = [-90, ((i+1)*10)-90.00000]
pointList = [p1, p2, p3, p4, p1]
poly = geometry.Polygon(pointList)
globeLat.loc[i] = [(i*15-180) , poly]
display(globeLat)
I then try to use the globeLat dataframe with gv.Polygons() and get a ValueError. The line I try to call is below:
polys = gv.Polygons(shapesDF, vdims = ['zone']).opts(width = 800, height = 400)
This produces the following error:
ValueError                                Traceback (most recent call last)
<ipython-input-28-d1c663f14ed1> in <module>
  5 points = data.to(gv.Points, ['Longitude', 'Latitude'], ['Temperature(C)'])
  6 # osm_map = gv.tile_sources.OSM
----> 7 polys = gv.Polygons(shapesDF, vdims = ['zone']).opts(width = 800, height = 400)
  8 oceanMap = gf.ocean()
  9 oceanMap.opts(width = 800, height = 400) * polys * points.opts(tools=['hover'], size=10)

~\Anaconda3\envs\geoviews_test\lib\site-packages\geoviews\element\geo.py in __init__(self, data, kdims, vdims, **kwargs)
108         elif isinstance(data, _Element):
109             kwargs['crs'] = data.crs
--> 110         super(_Element, self).__init__(data, kdims=kdims, vdims=vdims, **kwargs)
111
112

~\Anaconda3\envs\geoviews_test\lib\site-packages\holoviews\element\path.py in __init__(self, data, kdims, vdims, **params)
262         else:
263             params['vdims'] = vdims
--> 264         super(Contours, self).__init__(data, kdims=kdims, **params)
265         if params.get('level') is not None:
266             with disable_constant(self):

~\Anaconda3\envs\geoviews_test\lib\site-packages\holoviews\element\path.py in __init__(self, data, kdims, vdims, **params)
 83             data = paths
 84
---> 85         super(Path, self).__init__(data, kdims=kdims, vdims=vdims, **params)
 86
 87

~\Anaconda3\envs\geoviews_test\lib\site-packages\holoviews\element\selection.py in __init__(self, *args, **kwargs)
 19
 20     def __init__(self, *args, **kwargs):
---> 21         super(SelectionIndexExpr, self).__init__(*args, **kwargs)
 22         self._index_skip = False
 23

~\Anaconda3\envs\geoviews_test\lib\site-packages\holoviews\core\data\__init__.py in __init__(self, data, kdims, vdims, **kwargs)
342                                            datatype=kwargs.get('datatype'))
343         (data, self.interface, dims, extra_kws) = initialized
--> 344         super(Dataset, self).__init__(data, **dict(kwargs, **dict(dims, **extra_kws)))
345         self.interface.validate(self, validate_vdims)
346

~\Anaconda3\envs\geoviews_test\lib\site-packages\holoviews\core\dimension.py in __init__(self, data, kdims, vdims, **params)
852             params['cdims'] = {d if isinstance(d, Dimension) else Dimension(d): val
853                                for d, val in params['cdims'].items()}
--> 854         super(Dimensioned, self).__init__(data, **params)
855         self.ndims = len(self.kdims)
856         cdims = [(d.name, val) for d, val in self.cdims.items()]

~\Anaconda3\envs\geoviews_test\lib\site-packages\holoviews\core\dimension.py in __init__(self, data, id, plot_id, **params)
511             params['group'] = long_name
512
--> 513         super(LabelledData, self).__init__(**params)
514         if not util.group_sanitizer.allowable(self.group):
515             raise ValueError("Supplied group %r contains invalid characters." %

~\Anaconda3\envs\geoviews_test\lib\site-packages\param\parameterized.py in __init__(self, **params)
   2520
   2521         self.param._generate_name()
-> 2522         self.param._setup_params(**params)
   2523         object_count += 1
   2524

~\Anaconda3\envs\geoviews_test\lib\site-packages\param\parameterized.py in override_initialization(self_, *args, **kw)
   1063         original_initialized = parameterized_instance.initialized
   1064         parameterized_instance.initialized = False
-> 1065         fn(parameterized_instance, *args, **kw)
   1066         parameterized_instance.initialized = original_initialized
   1067     return override_initialization

~\Anaconda3\envs\geoviews_test\lib\site-packages\param\parameterized.py in _setup_params(self_, **params)
   1311                 self.param.warning("Setting non-parameter attribute %s=%s using a mechanism intended only for parameters", name, val)
   1312             # i.e. if not desc it's setting an attribute in __dict__, not a Parameter
-> 1313             setattr(self, name, val)
   1314
   1315     @classmethod

~\Anaconda3\envs\geoviews_test\lib\site-packages\param\parameterized.py in _f(self, obj, val)
316             instance_param.__set__(obj, val)
317             return
--> 318         return f(self, obj, val)
319     return _f
320

~\Anaconda3\envs\geoviews_test\lib\site-packages\param\parameterized.py in __set__(self, obj, val)
890             val = self.set_hook(obj,val)
891
--> 892         self._validate(val)
893
894         _old = NotImplemented

~\Anaconda3\envs\geoviews_test\lib\site-packages\param\__init__.py in _validate(self, val)
   1386             if min_length is not None and max_length is not None:
   1387                 if not (min_length <= l <= max_length):
-> 1388                     raise ValueError("%s: list length must be between %s and %s (inclusive)"%(self.name,min_length,max_length))
   1389             elif min_length is not None:
   1390                 if not min_length <= l:

ValueError: kdims: list length must be between 2 and 2 (inclusive)
I have used the same code with a shapefile I downloaded from here, and it works…the issue is the shapefile doesn’t recognize a lot of points in my data set. Is there something wrong with the way I built my custom dataframe?
EDIT: If it helps, here is my GitHub repo: https://github.com/JSLifeform/Ocean-Temperature-Comparisons/tree/broken
EDIT 2: I realized that I was using 360 degrees when it shoudl only be 180, fixed that but my issue remains.