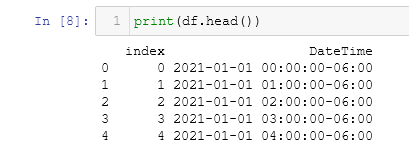
This minimal example shows different time labels for x-axis in notebook depending if plotting directly or in panel. Is there an easy fix?
import panel as pn
import matplotlib.pyplot as plt
import altair as alt
pn.extension('vega')
alt.renderers.enable('default')

df = pd.DataFrame(pd.date_range(start='1/1/2021', periods=5, freq='H'), columns = ['DateTime']).reset_index()
chart = alt.Chart(df).mark_point().encode(
    x = 'DateTime:T',
    y = 'index:Q'
)
#chart
pn.panel(chart)
