I find the holoviz panel a very interesting solution to building data visualisation dashboards. Unfortunately, I have some issues getting a vega plot of a node-link diagram to work within a panel in a jupyter notebook.
For a minimal script showing the issue, see at the bottom of this question.
My findings:
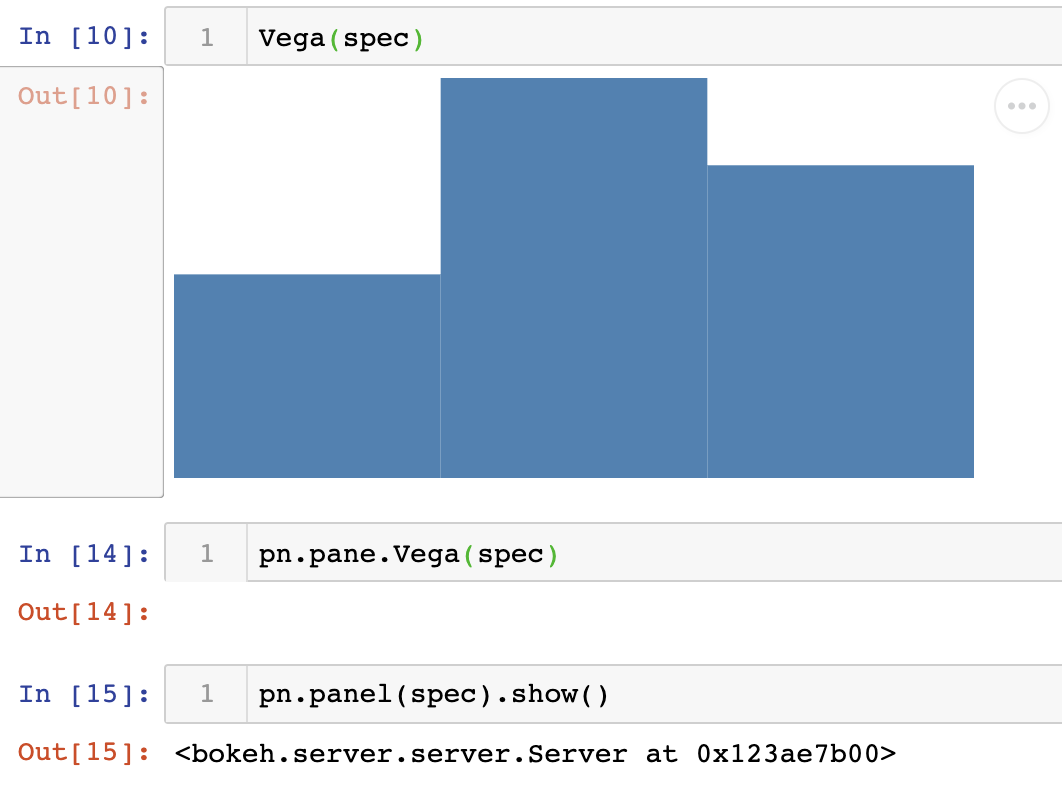
- The vega import works nicely when used outside of a panel: the Vega specification copy/pasted from https://vega.github.io/editor/#/examples/vega/force-directed-layout is visualised as it should be using
Vega(spec). - When using
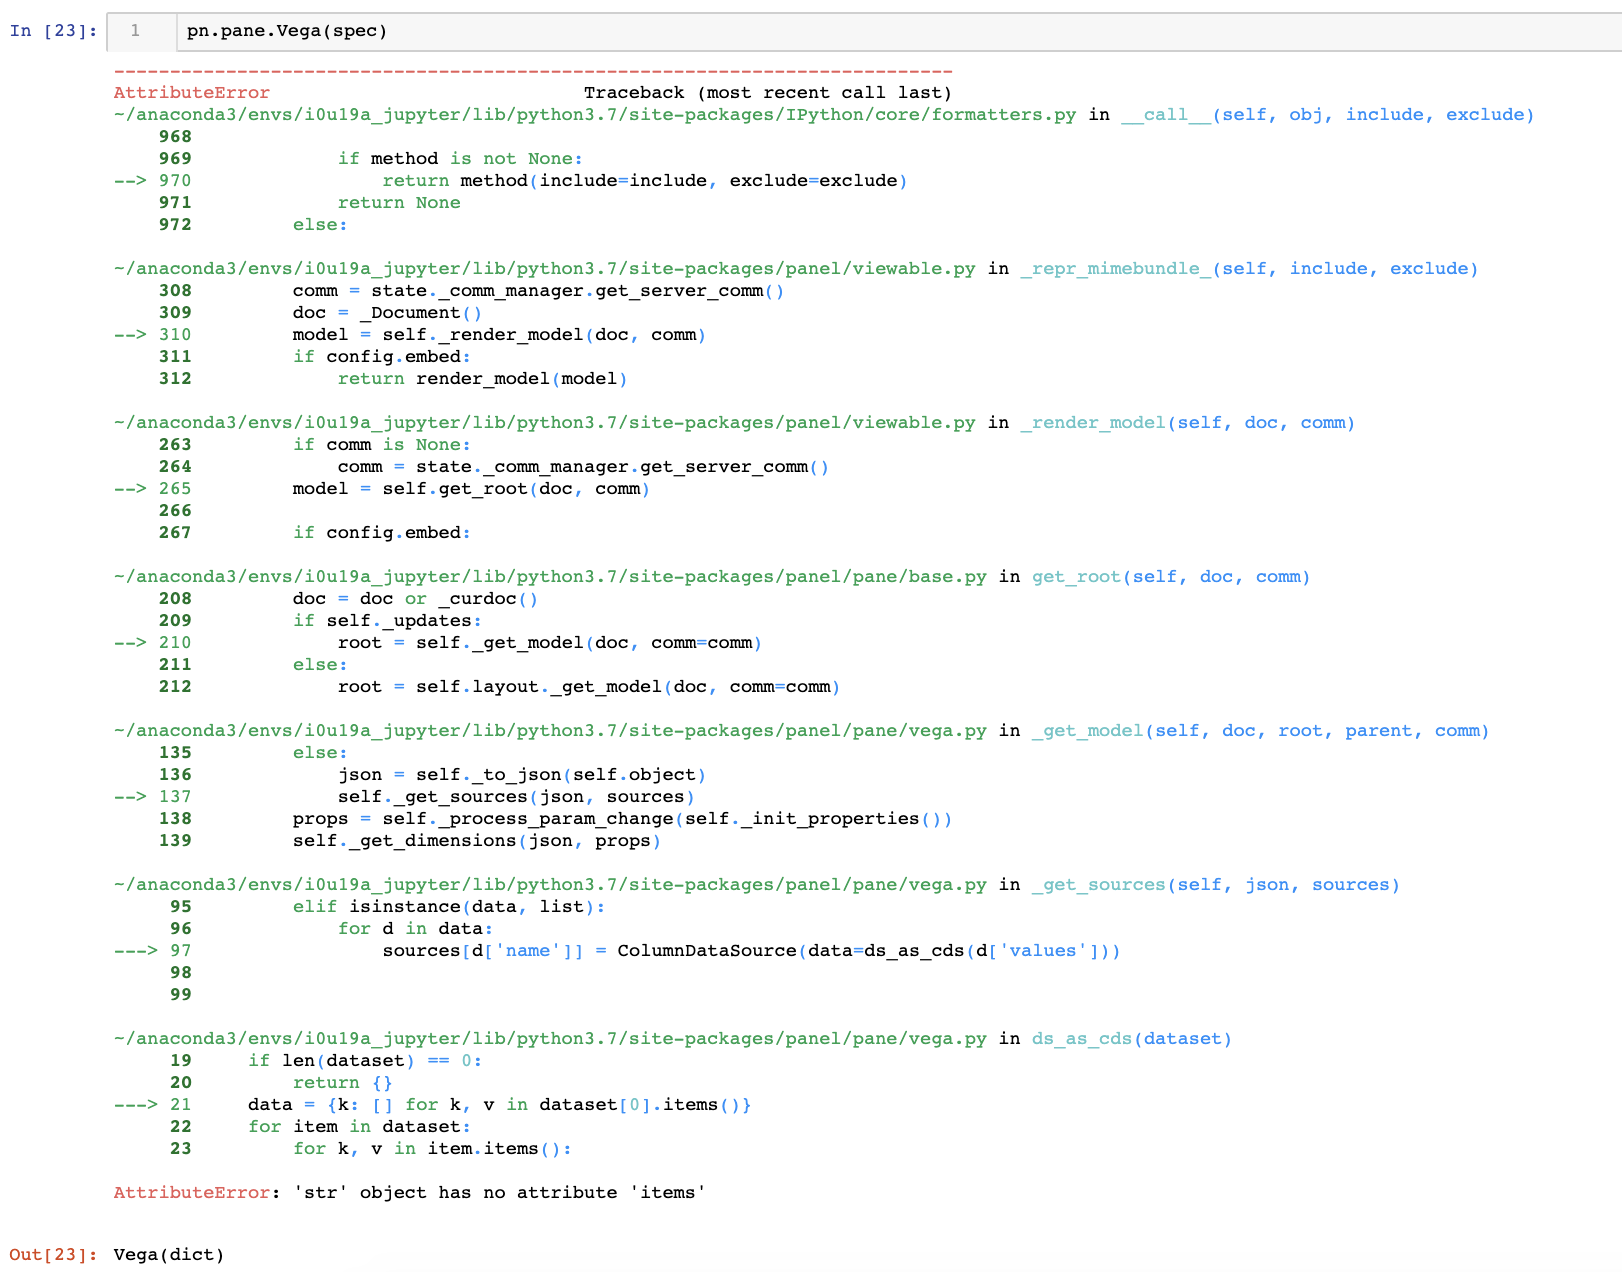
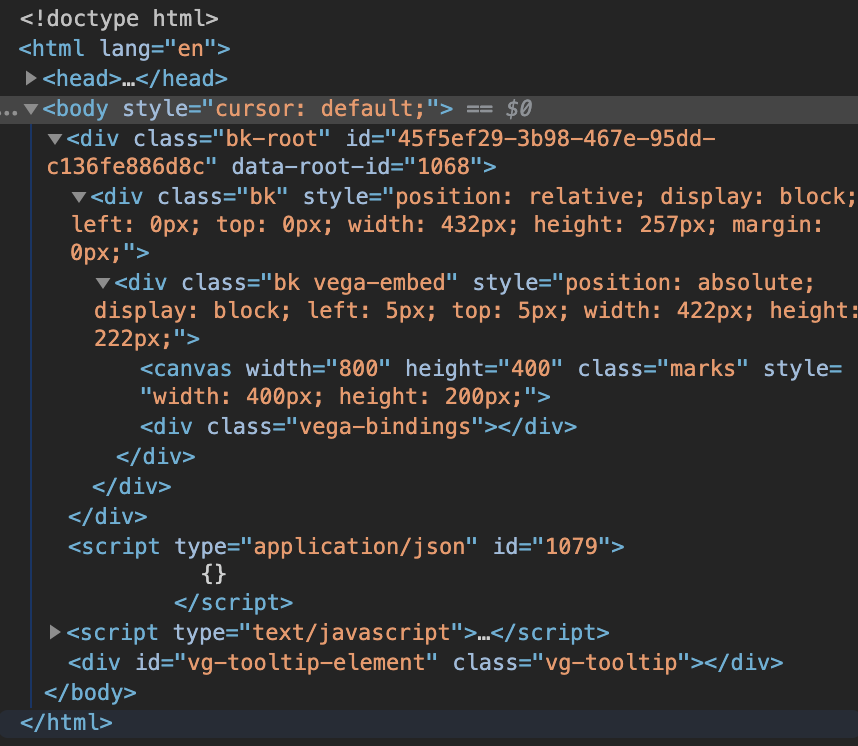
pn.pane.Vega(spec)I get an empty space. Running the visualisation externally usingpn.pane.Vega(spec).show()and looking at the source code, I see that the div is empty.
Any help with getting this working much appreciated…
#!/usr/bin/env python
import panel as pn
from bokeh.plotting import figure, output_notebook, show
from vega import VegaLite, Vega
pn.extension()
pn.extension('vega')
output_notebook()

spec = {
  "$schema": "https://vega.github.io/schema/vega/v5.json",
  "width": 400,
  "height": 200,

  "data": [
    {
      "name": "table",
      "values": [
        {"category": "A", "amount": 28},
        {"category": "B", "amount": 55},
        {"category": "C", "amount": 43}
      ]
    }
  ],

  "scales": [
    {
      "name": "xscale",
      "type": "band",
      "domain": {"data": "table", "field": "category"},
      "range": "width"
    },
    {
      "name": "yscale",
      "domain": {"data": "table", "field": "amount"},
      "range": "height"
    }
  ],

  "marks": [
    {
      "type": "rect",
      "from": {"data":"table"},
      "encode": {
        "enter": {
          "x": {"scale": "xscale", "field": "category"},
          "width": {"scale": "xscale", "band": 1},
          "y": {"scale": "yscale", "field": "amount"},
          "y2": {"scale": "yscale", "value": 0}
        },
        "update": {
          "fill": {"value": "steelblue"}
        }
      }
    }
  ]
}

Vega(spec) # => shows barchart => OK

pn.Column(pn.panel("## Vega test"),
          pn.pane.Vega(spec),
          pn.panel("_end of test_"))
# => shows "Vega test", then empty space, the "end of test"

pn.Column(pn.panel("## Vega test"),
          pn.panel(spec),
          pn.panel("_end of test_"))
# => shows "Vega test", then empty space, the "end of test"
Thank you,
jan.