I think I found another issue (sorry, @philippjfr :-/ ).
Vega and VegaLite don’t play nice in pn.Column and pn.Row: they don’t bump the other panes resulting in overlapping panes.
For example:
spec = {
"$schema": "https://vega.github.io/schema/vega-lite/v4.json",
"description": "A simple bar chart with embedded data.",
"data": {
"values": [
{"a": "A", "b": 28},
{"a": "B", "b": 55},
{"a": "C", "b": 43},
{"a": "D", "b": 91}
]
},
"mark": "bar",
"encoding": {
"x": {"field": "b", "type": "quantitative"},
"y": {"field": "a", "type": "nominal"}
}
}
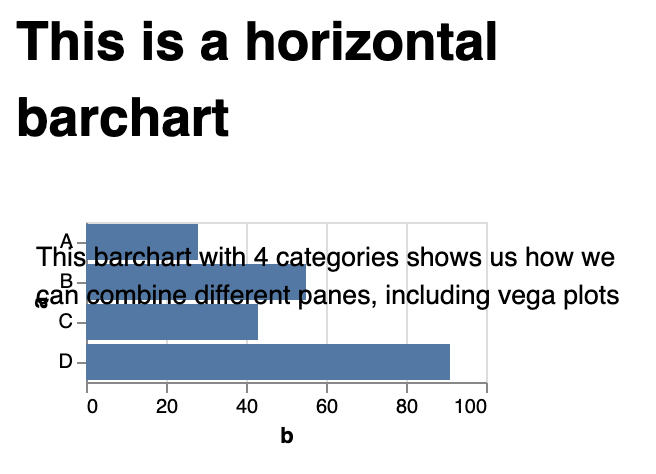
pn.Column(pn.pane.Markdown("# This is a horizontal barchart"),
pn.Row(
pn.pane.Vega(spec),
pn.panel("This barchart with 4 categories shows us how we can combine different panes, including vega plots")
)).show()
gives:
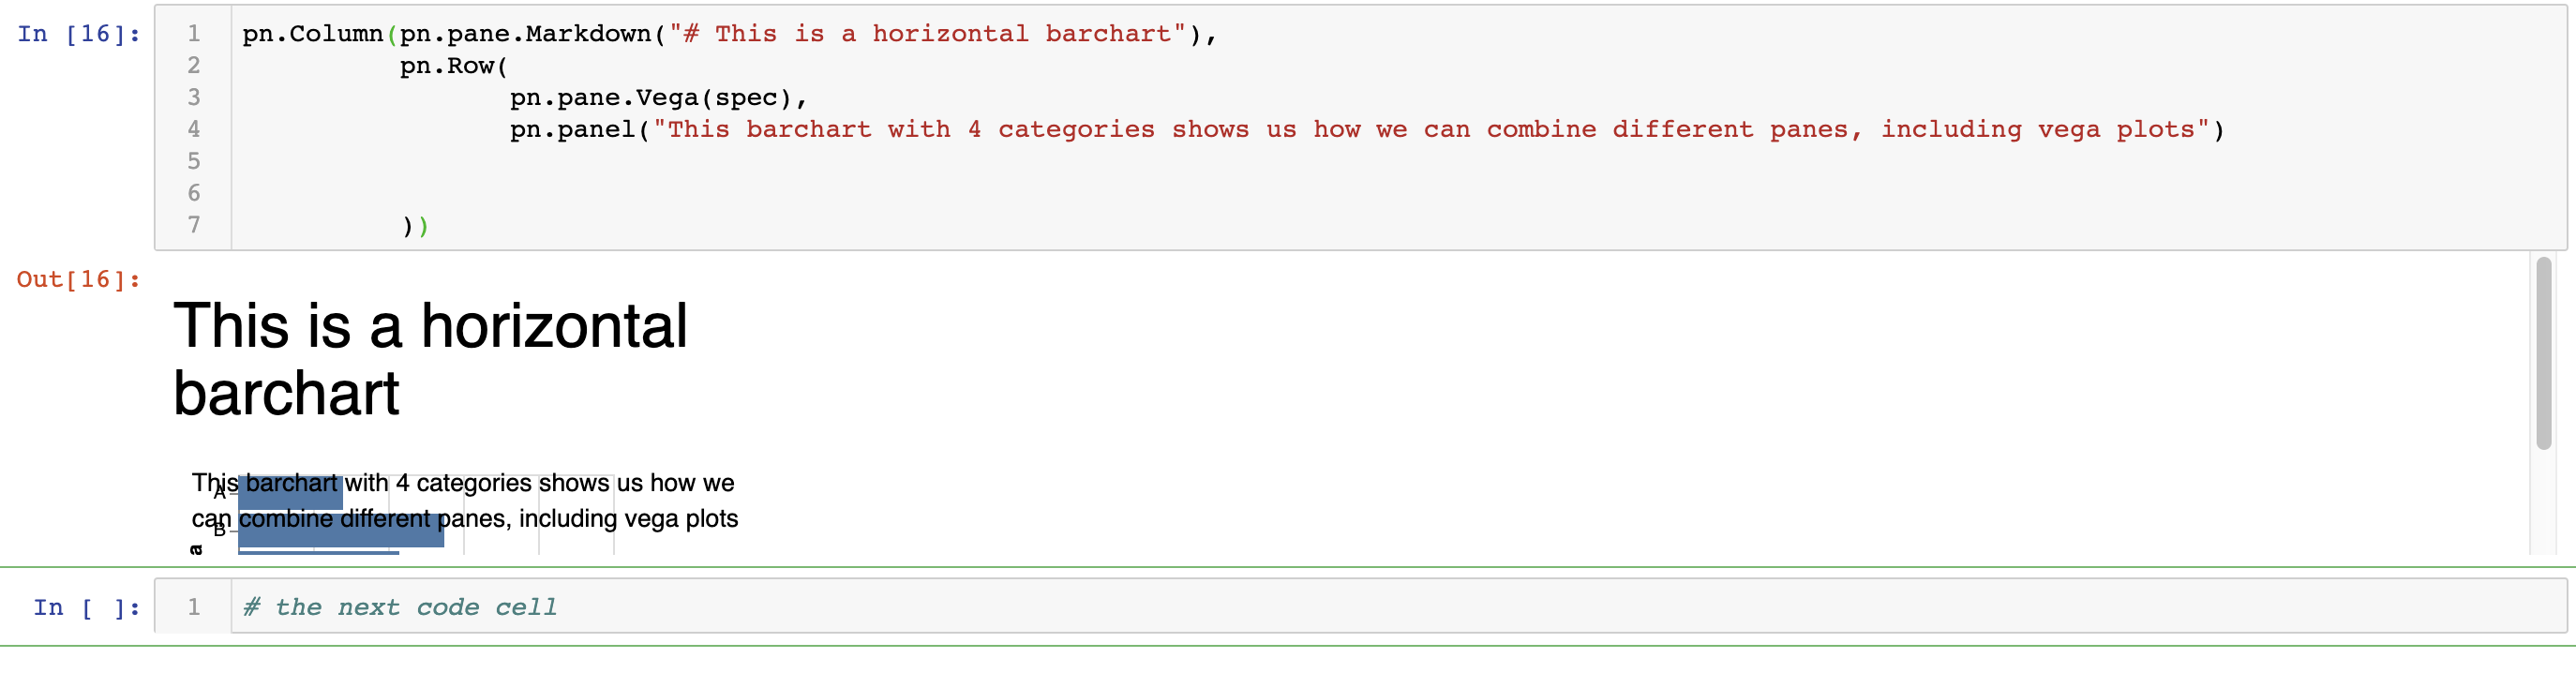
The same is true when I want to create two vega plots next to each other (e.g. just repeating the pn.pane.Vega(spec) in the code block above).
This is probably also the reason why I need to use the .show() in the example. If I don’t, the output is not shown entirely and the next code cell hides it, like this:
I do think it’s the vega and not markdown, because:
when I put 2 plots next to each other as a pn.Row or pn.Column they also overlap
when I just show 1 plot within jupyter notebook, the plot is cut off by the next code cell and I have to scroll the output itself to see the rest of the plot. In the picture, for example, there are 4 (!) bars as well as a x-axis with label.
BTW: This work is to be integrated in a vegalite/vega/holoviz tutorial that I’m writing for several courses and workshops. The current version is at http://vda-lab.be/visualisation-tutorial. Still a lot of work to be done for holoviz, but I’ll get there… It’s in writing these tutorials that I came across these issues
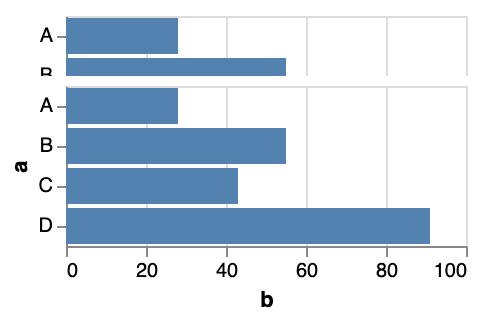
Sadly I’m still seeing this issue on master. The problem is that without an explicit width, height declared as part of the spec neither Panel nor Bokeh can figure out the size of the object.
If you add a width and height to the spec it seems to work okay: