Thanks for the solution @Hoxbro, I’m afraid my simplified example was too easy for you to solve and I’m having a hard time transferring your logic to my actual problem.
Here is the “real” component that I’m trying to make:
class Percentile(pn.viewable.Viewer):
percentiles = param.ListSelector(default=[], objects=['10th/90th', '20th/80th', '30th/70th', '40th/60th'])
def __init__(self, df):
super().__init__()
self.df = df
self._plot_pane = pn.pane.HoloViews()
self._layout = pn.Column(
pn.Param(self.param.percentiles, widgets={
'percentiles': pn.widgets.CheckButtonGroup,
}),
self._plot_pane,
sizing_mode='stretch_width'
)
self.init_plot()
# This solution also does not work
# @param.depends('percentiles', watch=True, on_init=True)
# def _update_plot(self):
# """Change visibility of percentiles based on inputs"""
# if self.percentiles:
# print('did update', self._plot_pane.object.opts.info())
# if '10th/90th' in self.percentiles:
# print('we do it')
# self._plot_pane.object.Area.I.apply.opts(visible = True)
# print(self._plot_pane.object.Area.I.opts.info())
# if '20th/80th' in self.percentiles:
# self.layer4.visible = True
# if '30th/70th' in self.percentiles:
# self.layer3.visible = True
# if '40th/60th' in self.percentiles:
# self.layer3.visible = True
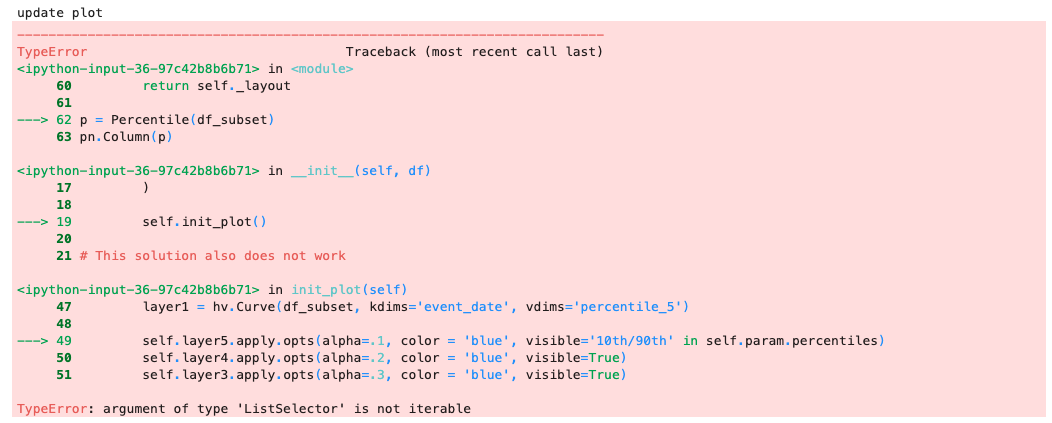
def init_plot(self):
print('update plot')
self.layer5 = hv.Area(df_subset, kdims='event_date', vdims=['percentile_1', 'percentile_9'])
self.layer4 = hv.Area(df_subset, kdims='event_date', vdims=['percentile_2', 'percentile_8'])
self.layer3 = hv.Area(df_subset, kdims='event_date', vdims=['percentile_3', 'percentile_7'])
self.layer2 = hv.Area(df_subset, kdims='event_date', vdims=['percentile_4', 'percentile_6'])
layer1 = hv.Curve(df_subset, kdims='event_date', vdims='percentile_5')
# self.layer5.apply.opts(alpha=.1, color = 'blue', visible='10th/90th' in self.param.percentiles)
self.layer4.apply.opts(alpha=.2, color = 'blue', visible=True)
self.layer3.apply.opts(alpha=.3, color = 'blue', visible=True)
self.layer2.apply.opts(alpha=.4, color = 'blue', visible=True)
layer1.opts(color='blue')
layout = self.layer5 * self.layer4 * self.layer3 * self.layer2 * layer1
layout.opts(responsive=True, height=500)
self._plot_pane.object = layout
def __panel__(self):
return self._layout
p = Percentile(df_subset)
pn.Column(p)
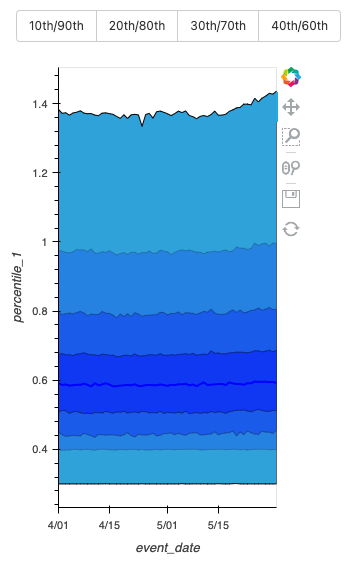
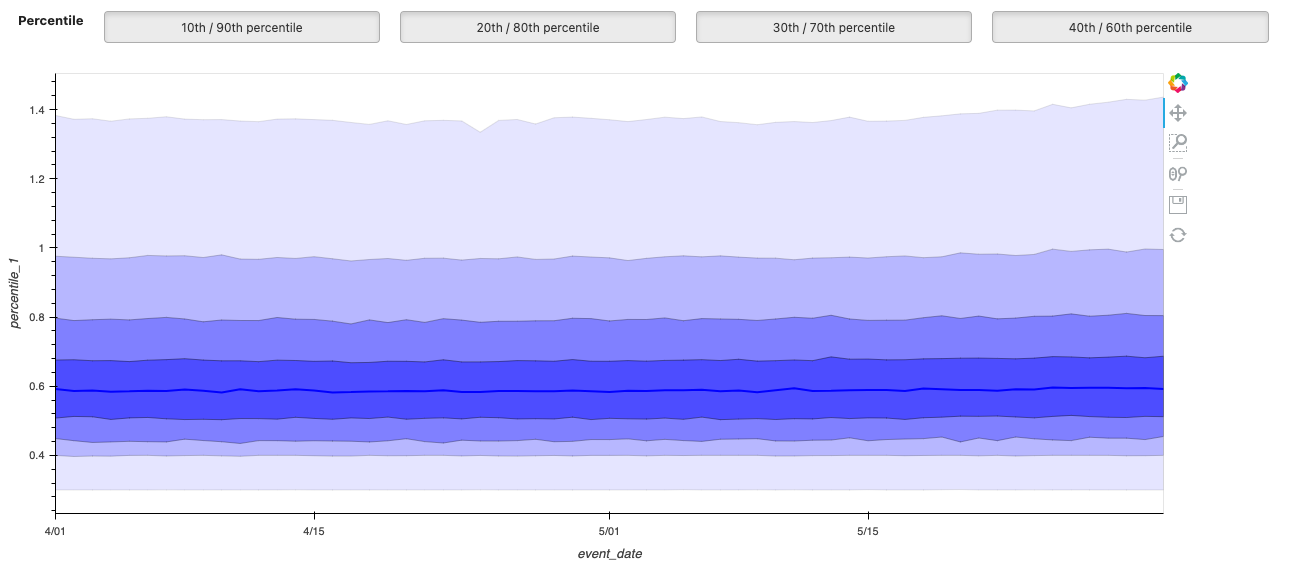
Which outputs something that shows the different percentiles in different alpha hues. The intention is for the user to be able to select which percentiles they wish to view and hide the rest.
In the code snippet above, I try out two solutions. The first solution is commented out and is more similar to my original request with the color param.
The other line that I comment out:
# self.layer5.apply.opts(alpha=.1, color = 'blue', visible='10th/90th' in self.param.percentiles)
Is my attempt to transfer your solution to this new situation. Unfortunately, it doesn’t work.
With this additional context how might you approach making this component?