What is best practice for streaming using DynamicMap, Buffer and Panel widgets?

I’m trying to create a streaming application using HoloViews and the Buffer.

The resources to get me started is Working with Streaming Data — HoloViews v1.18.0 where the Buffer is described.

After some time I figured out that I can use a function as input to the DynamicMap and not just a HoloViews plot element. I want to display rolling values etc.

Then I want to combine with widgets. Again after some time I found Responding to Events — HoloViews v1.18.0. And especially the section on Panel.

After some attempts I figured out that the Buffer is a Parameterized class with a data parameter holding the buffered value.

Now I can see many ways of doing this. For example the two below.

Questions

  1. Which is the best practice way of doing this?
  2. What optimizations does a DynamicMap do and when? (Its sometimes indicated that it can send the changes only to the client and thus update Bokeh much more efficiently. But this is totally unclear for me if it happens and how I can confirm it happens.)
  3. What optimizations does a Buffer do. Could I just as well use a custom TimeseriesBuffer with pn.bind as implemented below?
  4. What advantages (for example optimizations) does the Streamz library provide? When should I use it? How would the below example look using Streamz library?
  5. We are almost always streaming irregularly spaced timeseries data. Can the Buffer accept a TimeDelta instead of an integer window/ length?

HoloViews and streams dictionary

import panel as pn

pn.extension()

import pandas as pd
import panel as pn
import hvplot.pandas
import holoviews as hv
from holoviews.streams import Buffer
from asyncio import sleep
import numpy as np

pn.extension()


def new_row():
    return pd.DataFrame({"y": np.random.randn()}, index=[pd.Timestamp.now()])


dfstream = Buffer(new_row(), length=100, index=False)


def plot(data, window_seconds, alpha):
    data = data.rolling(f"{window_seconds}s").mean()
    return data.hvplot(y="y", ylim=(-1, 1), alpha=alpha, color="blue", line_width=5)


window_seconds = pn.widgets.IntSlider(value=5, start=1, end=10, name="Window (secs)")
alpha = pn.widgets.FloatSlider(value=1, start=0, end=1, name="Alpha")
iplot = hv.DynamicMap(
    plot,
    streams={
        "data": dfstream.param.data,
        "window_seconds": window_seconds.param.value,
        "alpha": alpha.param.value,
    },
)


pn.Column(iplot, window_seconds, alpha).servable()

async def run():
    while True:
        await sleep(0.1)
        row = new_row()
        dfstream.send(row)

pn.state.onload(run)

Panel and pn.bind

import panel as pn

pn.extension()

import pandas as pd
import panel as pn
import hvplot.pandas
import holoviews as hv
from holoviews.streams import Buffer
from asyncio import sleep
import numpy as np

pn.extension()


def new_row():
    return pd.DataFrame({"y": np.random.randn()}, index=[pd.Timestamp.now()])


dfstream = Buffer(new_row(), length=100, index=False)


def plot(data, window_seconds, alpha):
    data = data.rolling(f"{window_seconds}s").mean()
    return data.hvplot(y="y", ylim=(-1, 1), alpha=alpha, color="blue", line_width=5)


window_seconds = pn.widgets.IntSlider(value=5, start=1, end=10, name="Window (secs)")
alpha = pn.widgets.FloatSlider(value=1, start=0, end=1, name="Alpha")
iplot = hv.DynamicMap(
    pn.bind(plot, data=dfstream.param.data, window_seconds=window_seconds, alpha=alpha)
)

pn.Column(iplot, window_seconds, alpha).servable()

async def run():
    while True:
        await sleep(0.1)
        row = new_row()
        dfstream.send(row)

pn.state.onload(run)

Custom TimeseriesBuffer

class TimeseriesBuffer(param.Parameterized):
    data: DataFrame = param.DataFrame(allow_None=False)
    window: Timedelta = param.ClassSelector(class_=Timedelta, allow_None=False)

    def send(self, data: DataFrame):
        data = pd.concat([self.data, data])
        since = Timestamp.now() - self.window
        self.data = data[data.index>=since]

or an optimized version (?)

class TimeseriesBuffer(param.Parameterized):
    data: DataFrame = param.DataFrame(allow_None=False)
    window: Timedelta = param.ClassSelector(class_=Timedelta, allow_None=False)

    def send(self, new_rows: DataFrame):
        data = pd.concat([self.data, new_rows], sort=False)
        since = Timestamp.now() - self.window
        data.drop(data.index[data.index<since], inplace=True)
        self.data = data
1 Like
  1. The best way is to probably stick to the HoloViews documentation and use Pipe for updating all data, and Buffer for append-only. However, as you’ve already noted, we’d preferably be able to patch data as well. What’s maybe not so well-known is that DynamicMap also supports param objects as streams. Panel has made some efforts to create custom Param classes with stream & patch events.
  2. As mentioned in 1., you’d ideally want a combination of patch/stream events. Neither Pipe nor Buffer support both. But there’s custom panel classes like the DataFrame & Tabulator that support both streaming & patching. However, last time I’ve checked, their jslink was broken. If this were fixed, you could efficiently update plots based on only the changed data.
  3. Buffer holds either a limited or unlimited number of data points, but neither sorts, nor replaces existing keys. So, it wouldn’t work with timeseries that update an existing datetime key.
  4. Streamz is very convenient, but doesn’t currently support Holoviews’ nice layout features. So, I wrote my own plot class:
@Stream.register_api()    
class DMap(Sink,param.Parameterized):
    # ToDo: Once pn.widgets.DataFrame jslink is fixed, use it here instead of pipe
    hvplot = pn.pane.HoloViews()
    plot_fn = param.Callable(instantiate=True)
    initialized = None
    
    def __init__(self,upstream,name,plot_fn,value_cols=[],**kwargs):
        Stream.__init__(self, upstream, **kwargs)
        param.Parameterized.__init__(self, **kwargs)
        self.param.update(plot_fn=plot_fn)
        self.value_cols = value_cols
    
    @gen.coroutine
    def update(self,x,who=None,metadata=None):
        if not hasattr(self,'pipe'):
            self.param.add_parameter('data_container',param.DataFrame(x[self.value_cols]))
            self.pipe = Pipe(x[self.value_cols])
            self.dmap = hv.DynamicMap(self.plot_fn,kdims=[],streams=[self.pipe])
            self.hvplot.param.update(object=self.dmap)
        else:
            if len(self.data_container):
                self.data_container.update(x[self.value_cols]) # update values of existing keys
                x = x[self.value_cols].loc[self.data_container.index[-1]:].iloc[1:] # values of non-overlapping keys
            x = pd.concat([self.data_container,x[self.value_cols]]) # ToDo: Update existing keys, cutoff length/date
            self.param.update(data_container = x[self.value_cols])
            self.pipe.send(x[self.value_cols])
            
    def _ipython_display_(self):
        # Display plot pane as repr in notebook
        return display(self.hvplot)

Example use:

def plot_fn_OHLC(
    data:pd.DataFrame, # dataframe with trades data
) -> hv.Curve: # returns a Curve hvplot
    """
    Returns a basic hvplot with index as x, and the rest as y. Has range-following hook for syncing multiple charts when stacked.
    """
    return (
        data
        .hvplot.ohlc(**bk_default_kwargs)
        .opts(**{
            'min_height':320,
            'yaxis':'right',
            'hooks':[partial(range_following,x_range_custom=x_range_custom_init)]
        })
    )

CVD_takers_base_resampled_price_plot_OHLC = (
    CVD_takers_base_resampled_OHLC
    .DMap(
        plot_fn=plot_fn_OHLC,
        value_cols=['open','high','low','close'],
        name='CVD_takers_base_resampled_price_plot_OHLC'
    )
    # .HvPlot(plot_fn=plot_fn,value_cols=['price'])
)

You can then easily make composite plots like this:

price_plot = CVD_takers_base_resampled_price_plot.dmap.opts(xaxis='top',clone=True,hooks=[crosshair,watermark,y_formatter,partial(range_following,x_range_custom=x_range_custom)])
price_plot_OHLC = CVD_takers_base_resampled_price_plot_OHLC.dmap.opts(xaxis='top',clone=True,hooks=[crosshair,watermark,y_formatter,partial(range_following,x_range_custom=x_range_custom)])

composite_plot = (price_plot + price_plot_OHLC).cols(1)

  1. Unfortunately, no. But you can use alternatives like the above.
1 Like

The way I used streamz for a similar app is in

It defines two GraphicalMonitor classes to display the evolution of numerical computations.

1 Like

Maybe the last two sections in this docs I made long ago is relevant:
https://pydeas.readthedocs.io/en/latest/holoviz_interactions/tips_and_tricks.html#Wrap-DynamicMap-around-Panel-methods-to-maintain-extents-and-improve-runtime

So my suggestion is always use hv.DynamicMap in some way, shape, or form if you’re plotting something.

2 Likes

That is a good point @ahuang11 . If you or others can share what a DynamicMap does under the hood it would be really valuable. Right now the documentation is very sparse DynamicMap.

Unfortunately, I don’t really know what it does under the hood :stuck_out_tongue:

That’s the first time I saw that page. I used to visit these a lot:
https://holoviews.org/user_guide/Responding_to_Events.html#a-simple-dynamicmap
https://holoviews.org/user_guide/Live_Data.html

I have this error when running your code, am I missing something?

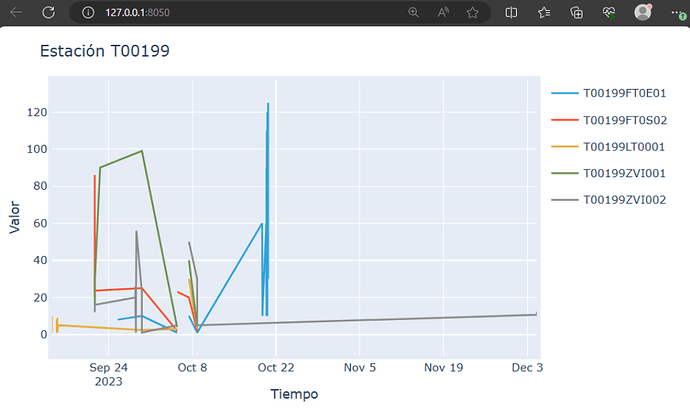
Could you help me? I am new with Holoviews, I have this code in python and I don’t know how to make the graph consult the database every 20 seconds in search of new data to graph

# Importar librerías
import polars as pl
from dash import html,Dash

import holoviews as hv
from holoviews.plotting.plotly.dash import to_dash
from sqlalchemy import create_engine
def curva():
    ER = "T00199"
    REGISTROS = 'T00199FT0E01 T00199FT0S02 T00199LT0001 T00199ZVI001 T00199ZVI002'
    REGISTROS = REGISTROS.split(' ')
    conn = create_engine(f"sqlite:///HIST/{ER}.db").connect()
    df = []
    curvas = []
    i = 0
    for REGISTRO in REGISTROS:
        query = f"SELECT tiempo,valor FROM {REGISTRO}"
        df.append(pl.read_database(query=query,connection=conn).with_columns(pl.col('tiempo').str.strptime(pl.Datetime,'%Y-%m-%d %H:%M:%S%.3f',strict=False).cast(pl.Datetime)))
        curvas.append(hv.Curve((df[i]['tiempo'], df[i]['valor']), 'Tiempo', 'Valor', label=f'{REGISTRO}').opts(show_legend=True,xaxis="bottom",xlabel="Tiempo",title=f"Estación {ER}",show_title=True))
        if i == 0:
            curve = curvas[i]
        elif i > 0:
            curve = curve * curvas[i]
        i = i+1
    conn.close()
    return [curve]

app = Dash(__name__)
components = to_dash(app,hvobjs=curva(), reset_button=False)
app.layout = html.Div(components.children)

if __name__ == "__main__":
    app.run(debug=True)

Maybe something like:

import panel as pn
import pandas as pd
import time

# Define a function to fetch new data from the database
def fetch_data():
    # Code to fetch data from the database
    # Replace this with your own code to retrieve data

    # For demonstration purposes, let's create a dummy DataFrame
    data = pd.DataFrame({'x': [1, 2, 3], 'y': [4, 5, 6]})
    return data

# Define a function to update the graph with new data
def update_graph():
    data = fetch_data()
    # Code to update the graph with new data
    # Replace this with your own code to update the graph

    # For demonstration purposes, let's print the data
    print(data)

# Create the initial graph
graph = pn.pane.Str("Initial graph")

# Add a periodic callback to update the graph every 20 seconds
pn.state.add_periodic_callback(update_graph, period=20000)

# Create a Panel layout with the graph
layout = pn.Column(graph)

# Show the layout
layout.servable()