I’m trying to understand the syntax for box/violin plot in holoviews so I can achieve something similar to what I get in pandas.
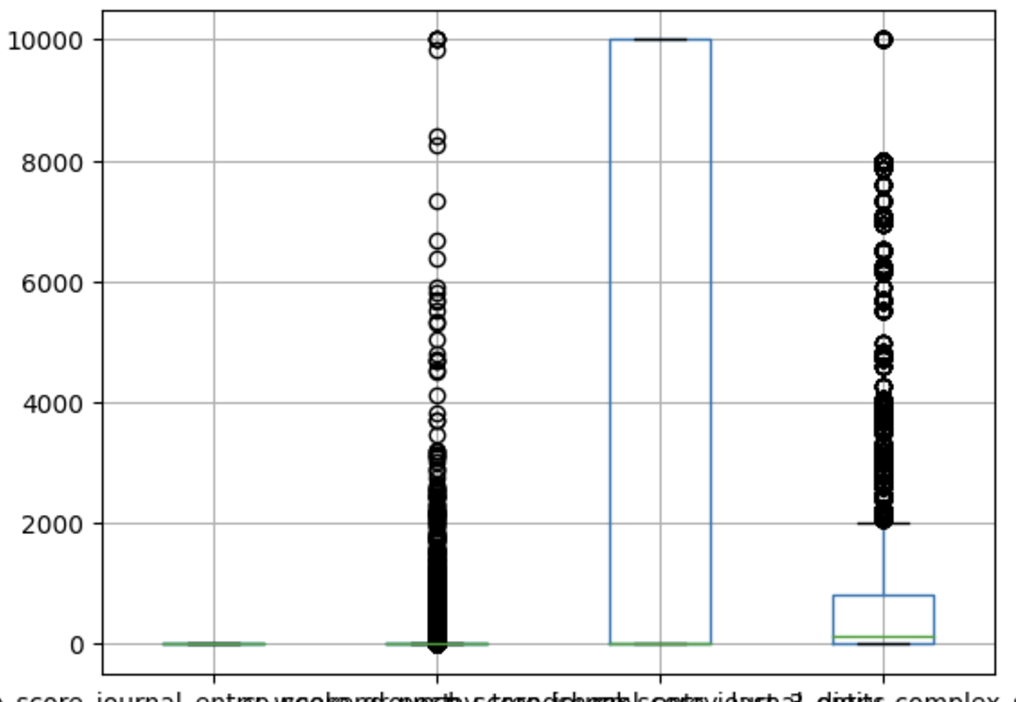
In pandas I can create side-by-side boxplots of the columns of a dataframe with the command: df.boxplot(column=<list of columns>). The result is suboptimal and non-interactive:
The closest example I’ve found is in the docs (see below). In my case I want side-by-side plots of the columns in my dataframe and I’m not understanding the syntax for the example and how to relate it to what I want.
groups = [chr(65+g) for g in np.random.randint(0, 3, 200)]

box = hv.BoxWhisker((groups, np.random.randint(0, 5, 200), np.random.randn(200)),
                    ['Group', 'Category'], 'Value').sort()

box.opts(height=400, width=600)
Thank you but the example for hvplot is similar to the code I posted. My use-case is a bit different eg. I don’t have a column that contains say ‘group’ and the another has the variable of interest like ‘time’. In my case, the column name is the group and its contents are the variable.
I have failed to find the holoviews source code so that I can see what the function’s parameters are. A link to that would be good.
This is what I mean. I’ve done it using plotly. I want to do it with holoviews but I don’t understand what the parameters are for boxplot, whiskerboxplot, or violin. The examples I’ve seen don’t explain how the function works ie. what its parameters are.
import plotly.graph_objects as go

df = pd.DataFrame({'A': np.random.randn(100), 'B': np.random.randn(100),'C': np.random.randn(100)})

fig = go.Figure()

for col in df.columns.tolist():
    fig.add_trace(go.Violin(y=df[col],
                            name=col,
                            box_visible=True,
                            meanline_visible=True))

fig.show()