In my panels I have nested tabs, with a lot of objects inside, also concatenated in a gridspect widgets.
So for example, if I want to update one of my widget I have to do this (for a molstar panel inside a gridspec):
Unfortunatly, no change are trigered when I simply do
moltar.custom_data = {.....}
Is there a easier/better way to access my molstar object (or other object… Could be Plotly as well) instead of specifying each indices like [0][1][0][0,3:10] ?
Your way of updating where you use all the indices does trigger an update?
In principle, they should either both work or both not work.
I forgot the details of the PDBeMolStar but I’m not 100% if you can update with custom data if initially the PDBeMolstar was created by specifying a molecule_id.
Maybe you could try creating molstar by doing PDBeMolStar(custom_data={..}) ?
Alternatively, you could create a layout and keep a reference do that and if you want to update then update its contents:
What is your experience with the PDBeMolStar component? Does it work well? Any issues or additional features you might need?
I’m curious about your application of the pdbemolstar component, so if you can share I’d love to know what you’re using it for? (or if you have code to share would be great as well)
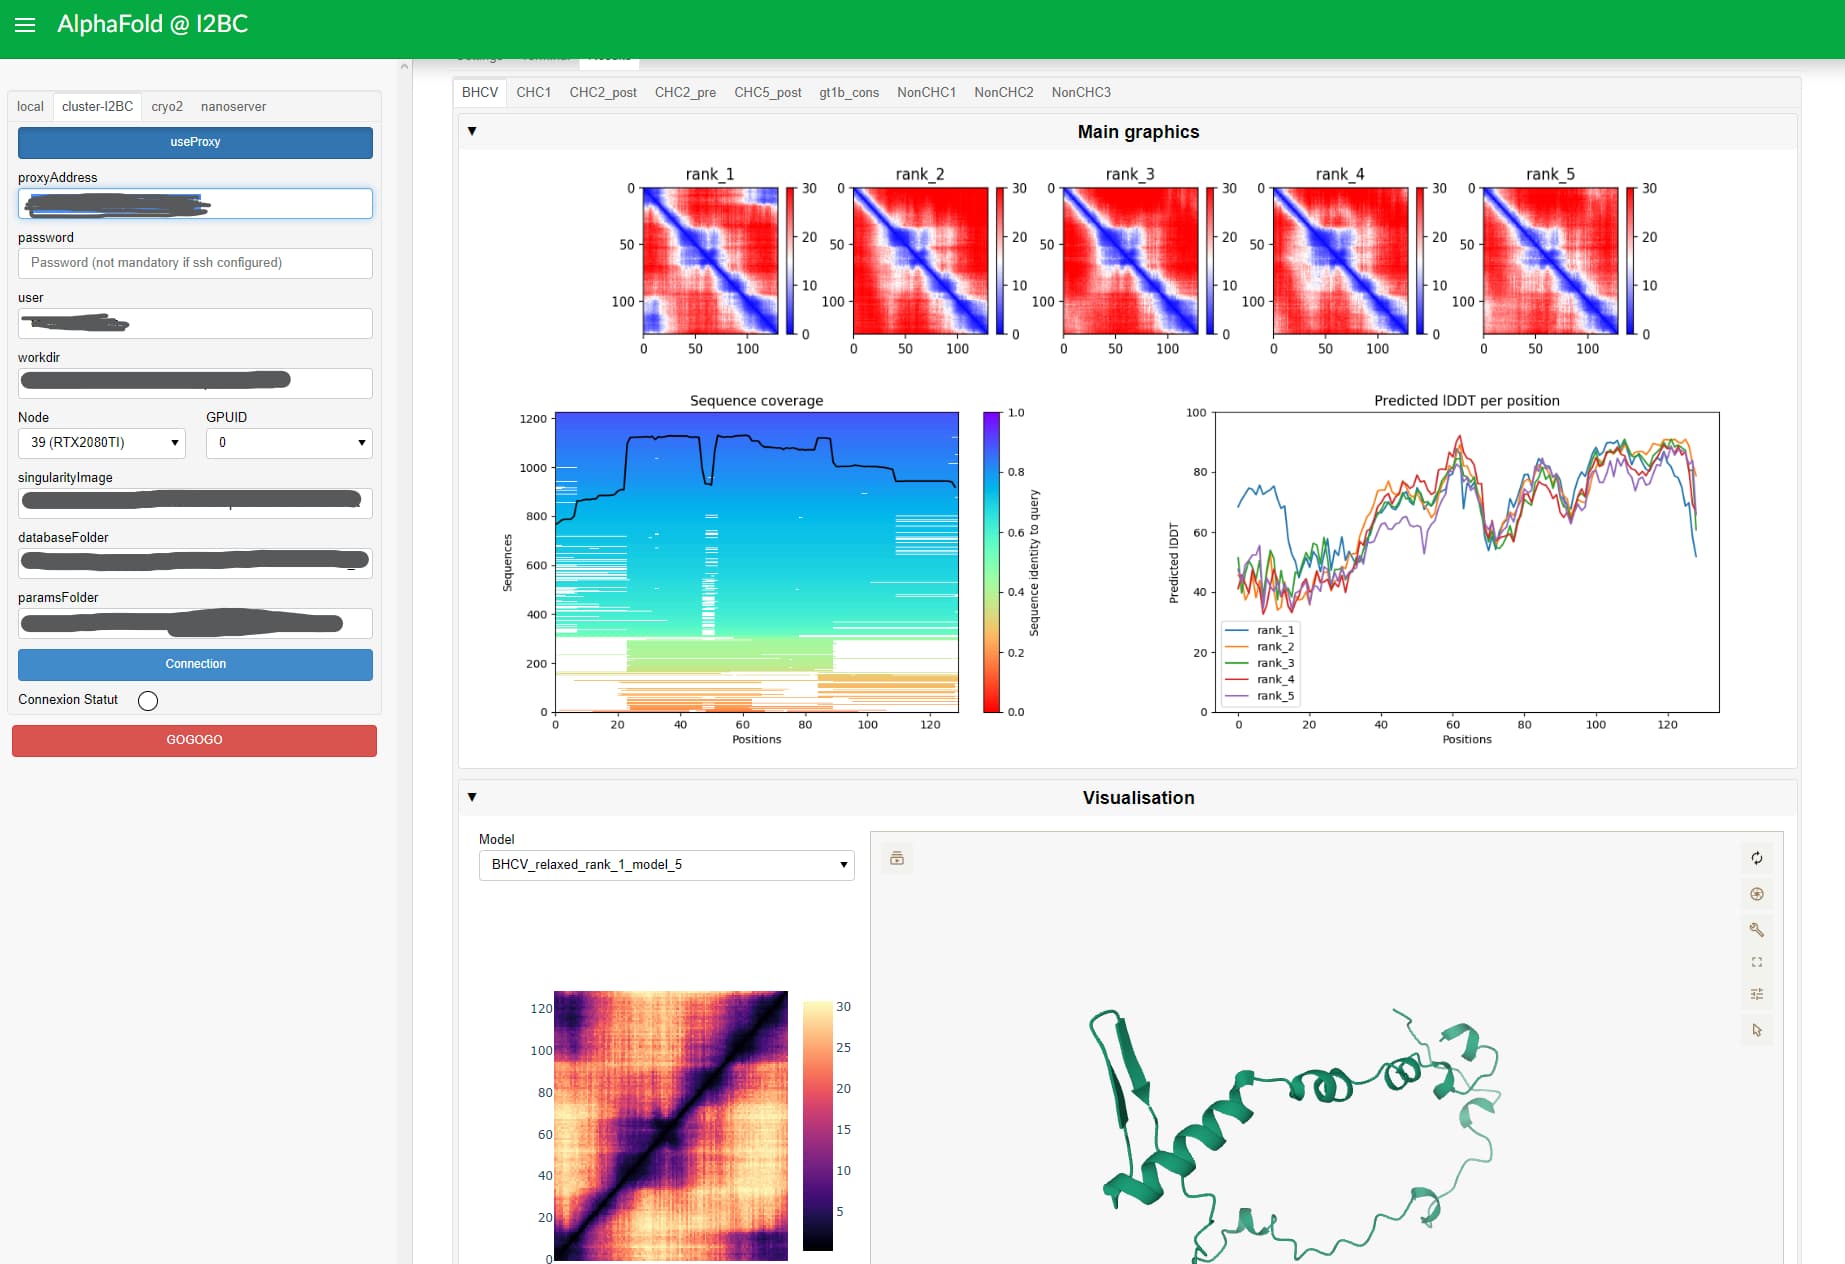
I’m currently bulding an interface to submit AlphaFold jobs in our clusters, and I wanted to add a tab to visualize the graphics and the structures.
It is quite messy right now because It is still under development when I have a bit of sparetime.
For now it works quite nicely although it is a bit more limited than the curent Molstar version. The molstar PDBe is quite outdated compare to the current molstar branch (missing new shaders, new viz, export possibilities…). But they said it should be updated soon (Request to support mol* version 3.x · Issue #54 · molstar/pdbe-molstar · GitHub, 1st week of may initially but it seems they are delayed).
The only bugs I can see now are :
there is sometime a persistent like a big black screen under the molstar component when the size of the component is changed, but in my previous team we already had this issue with a direct implementation of molstar trought its npm package. Apparently its coming from Molstar itself and it is fixed with the current version.
The “alphafold_view” to color pLDDT doesn’t work for local PDB structure, the ribbon is all gray ^^ (the Bfactor is still present on the PDB)
I will upload the code soon on github, I have to first load all the cluster connexion informations from a different and unversionned file (for security issue ^^). I will poke you here when it’s done
this has the pLDDT as Bfactor entry in the pdb files?
Yep
you’re only using the alphafold view colors ?
For now I just use the basic color per default, not the “Alphafold_view” colors. But if I change manually the colors from mol* config panels, I see the colors (inverted). Maybe the issue is that the protein is considered as “polymer”
I’m in the middle of the preparation of a result presentation (not related to this interface) so I’m a bit slow on the dev right now unfortunatly, but m final goal on this viewer is to be able to select part of the protein on the graph, and highlight them on the viewer (like on alphafold.ebi.ac.uk, example : AlphaFold Protein Structure Database if you select a region on the graph, it will be highlighted on the Molstar Viewer)