Going through the source code for the @classmethod def from_networkx the argument nodes doesn’t appear to be a data frame because:
a) if you use a dataframe the if node: boolean calls throw an error (would have to use instead ~nodes.empty)
b) refers to nodes.kdims which means it’s a holoviews object?
The docs don’t explain except (possibly) a reference that you can supply additional node information. In fact, it’s not apparent to me where in the method that the data is extracted from the networkx graph object.
In the bigger picture: I’m just trying to color nodes by type. The type is a node attribute in my networkx graph but that info doesn’t get extracted by the function and so the nodes color is transparent.
This is the code:
g_plot = hv.Graph.from_networkx(temp_g, nx.layout.spring_layout)
g_plot.opts(node_color='TYPE', cmap='Category10', height=600, width=600)
This is the node info from the graph (temp_g.nodes(data=True)):
[('n2549',
  {'TYPE': ':SalesOrderLineItem',
   'label': '1',
   'line_id': 1,
   'amount': 3718.5,
   'quantity': 184.0,
   'sales_order_internal_id': 1,
   'features': 'none'}),
 ('n124108', .... etc.]
I tried to put together a full example based on your description; here’s what I get:
import holoviews as hv
from holoviews import opts
import networkx as nx
hv.extension('bokeh')
opts.defaults(opts.Graph(width=400, height=400))
demo_nodes = [ ('n2549', {'TYPE': ':SalesOrderLineItem',
'label': '1',
'line_id': 1,
'amount': 3718.5,
'quantity': 184.0,
'sales_order_internal_id': 1,
'features': 'none'}),
('n2548', {'TYPE': ':SalesOrderLineItem',
'label': '1',
'line_id': 1,
'amount': 4000,
'quantity': 1,
'sales_order_internal_id': 2,
'features': 'none'}),
('n25497', {'TYPE': ':RevenueLineItem',
'label': '1',
'line_id': 1,
'amount': 4000,
'quantity': 12,
'sales_order_internal_id': 2,
'features': 'none'})]
demo_edges = [('n25497','n2548')]
temp_g = nx.Graph()
temp_g.add_nodes_from(demo_data)
temp_g.add_edges_from(demo_edges)
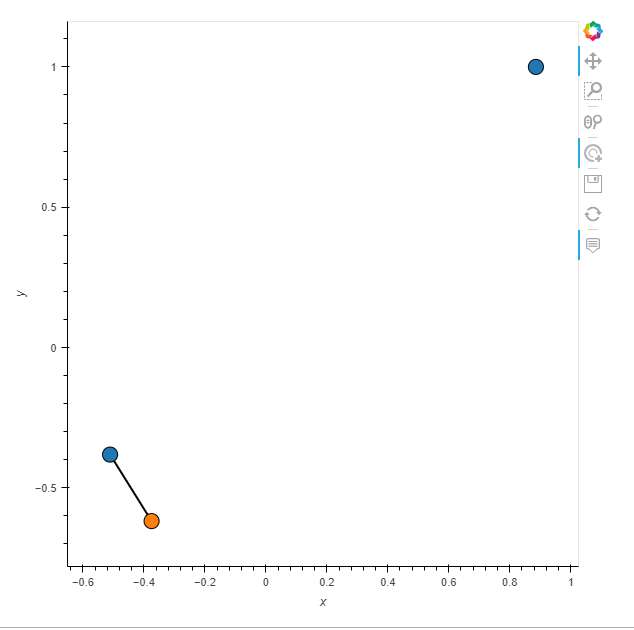
g_plot = hv.Graph.from_networkx(temp_g, nx.layout.spring_layout)
g_plot.opts(node_color='TYPE', cmap='Category10', height=600, width=600)
… on your side, did the image render but with no node colors?
Here are 2 other related answers that deal with node property mappings:
“simple” mapping case for node properties to out-of-box visualization elements:
Change the node shape of a network graph
“trickier” case with a callback for the glyphs
Oval shapes for holoviews.Nodes
I actually took the question to the ‘issues’ in the holoview repo. Try what you did but with attributes also on the edges. In my case, if the edges have no attributes the coloring works. If the edges do have attributes, then the coloring doesn’t work. My original thought was it might have something to do with the ‘nodes’ attribute but having looked at the code and in the absence of docs, I thought that might be the source of the problem.