Hi all,
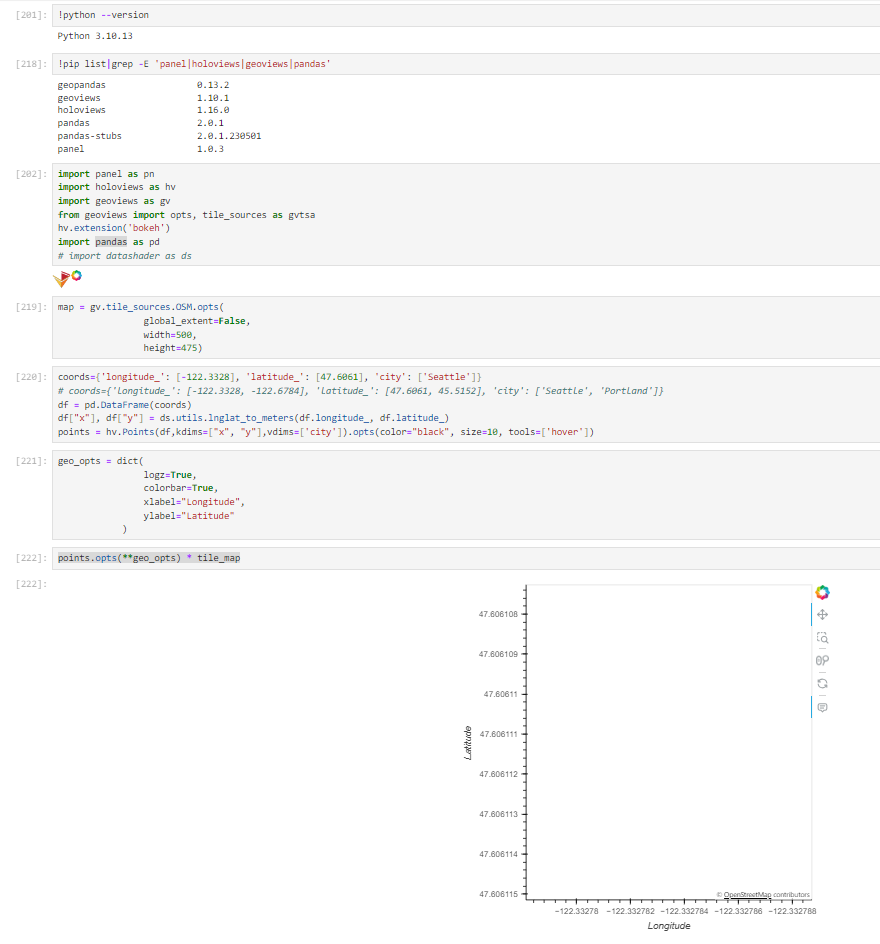
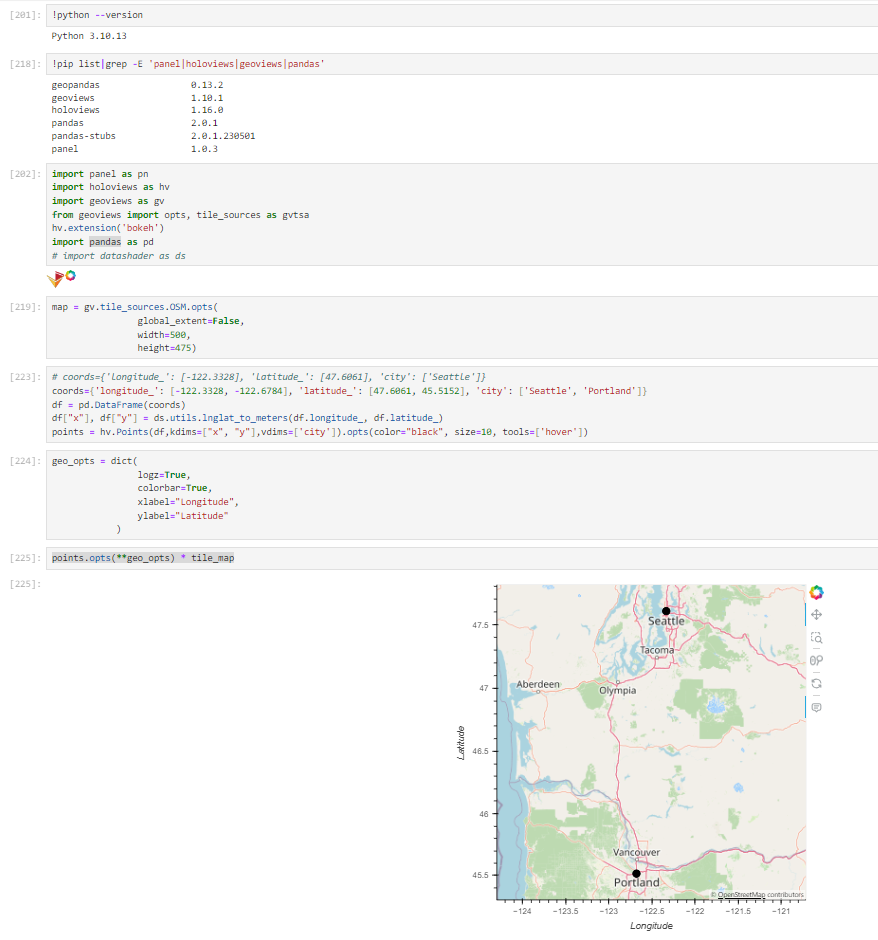
I’m new to visualizing spatial data. When I try to plot one point with the map in the background, the map is not showing. But if I add a second point to the dataset, it’s showing as desired.
I’ve made a minimum example code with two coords dataset, one with one point and the other one with two.
Hi @ahuang11
Thanks for your tips.
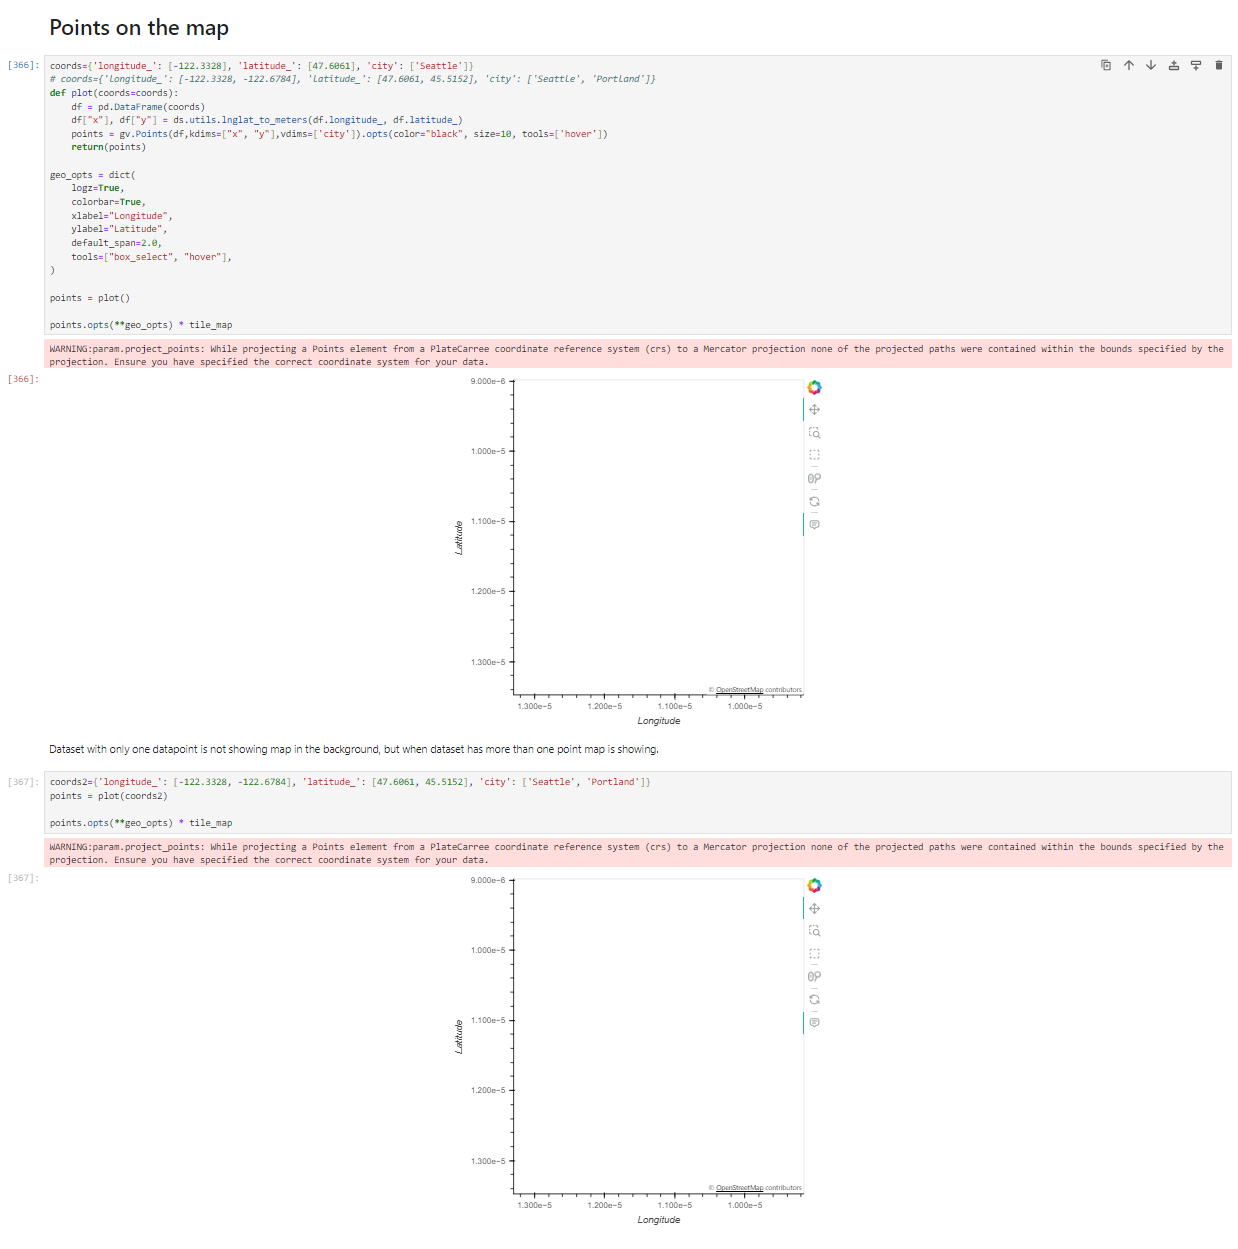
I tried gv.Points instead of hv.Points. Now, it doesn’t show map in either case (one point or more) with the following warning that I’m not sure how to resolve.
WARNING:param.project_points: While projecting a Points element from a PlateCarree coordinate reference system (crs) to a Mercator projection none of the projected paths were contained within the bounds specified by the projection. Ensure you have specified the correct coordinate system for your data.
Thank you so much for your help.
Again, it’s working when dataset has more than one data points.
In your code, when I eliminated Portland from the dataset which means that we left only with one data point in the dataset, then the map didn’t show in the background, neither it zoomed to the point.
I’m wondering if this is an edge case, or it needs some more settings.
The default_span=2.0 should do it, but even adding that didn’t solve the problem.