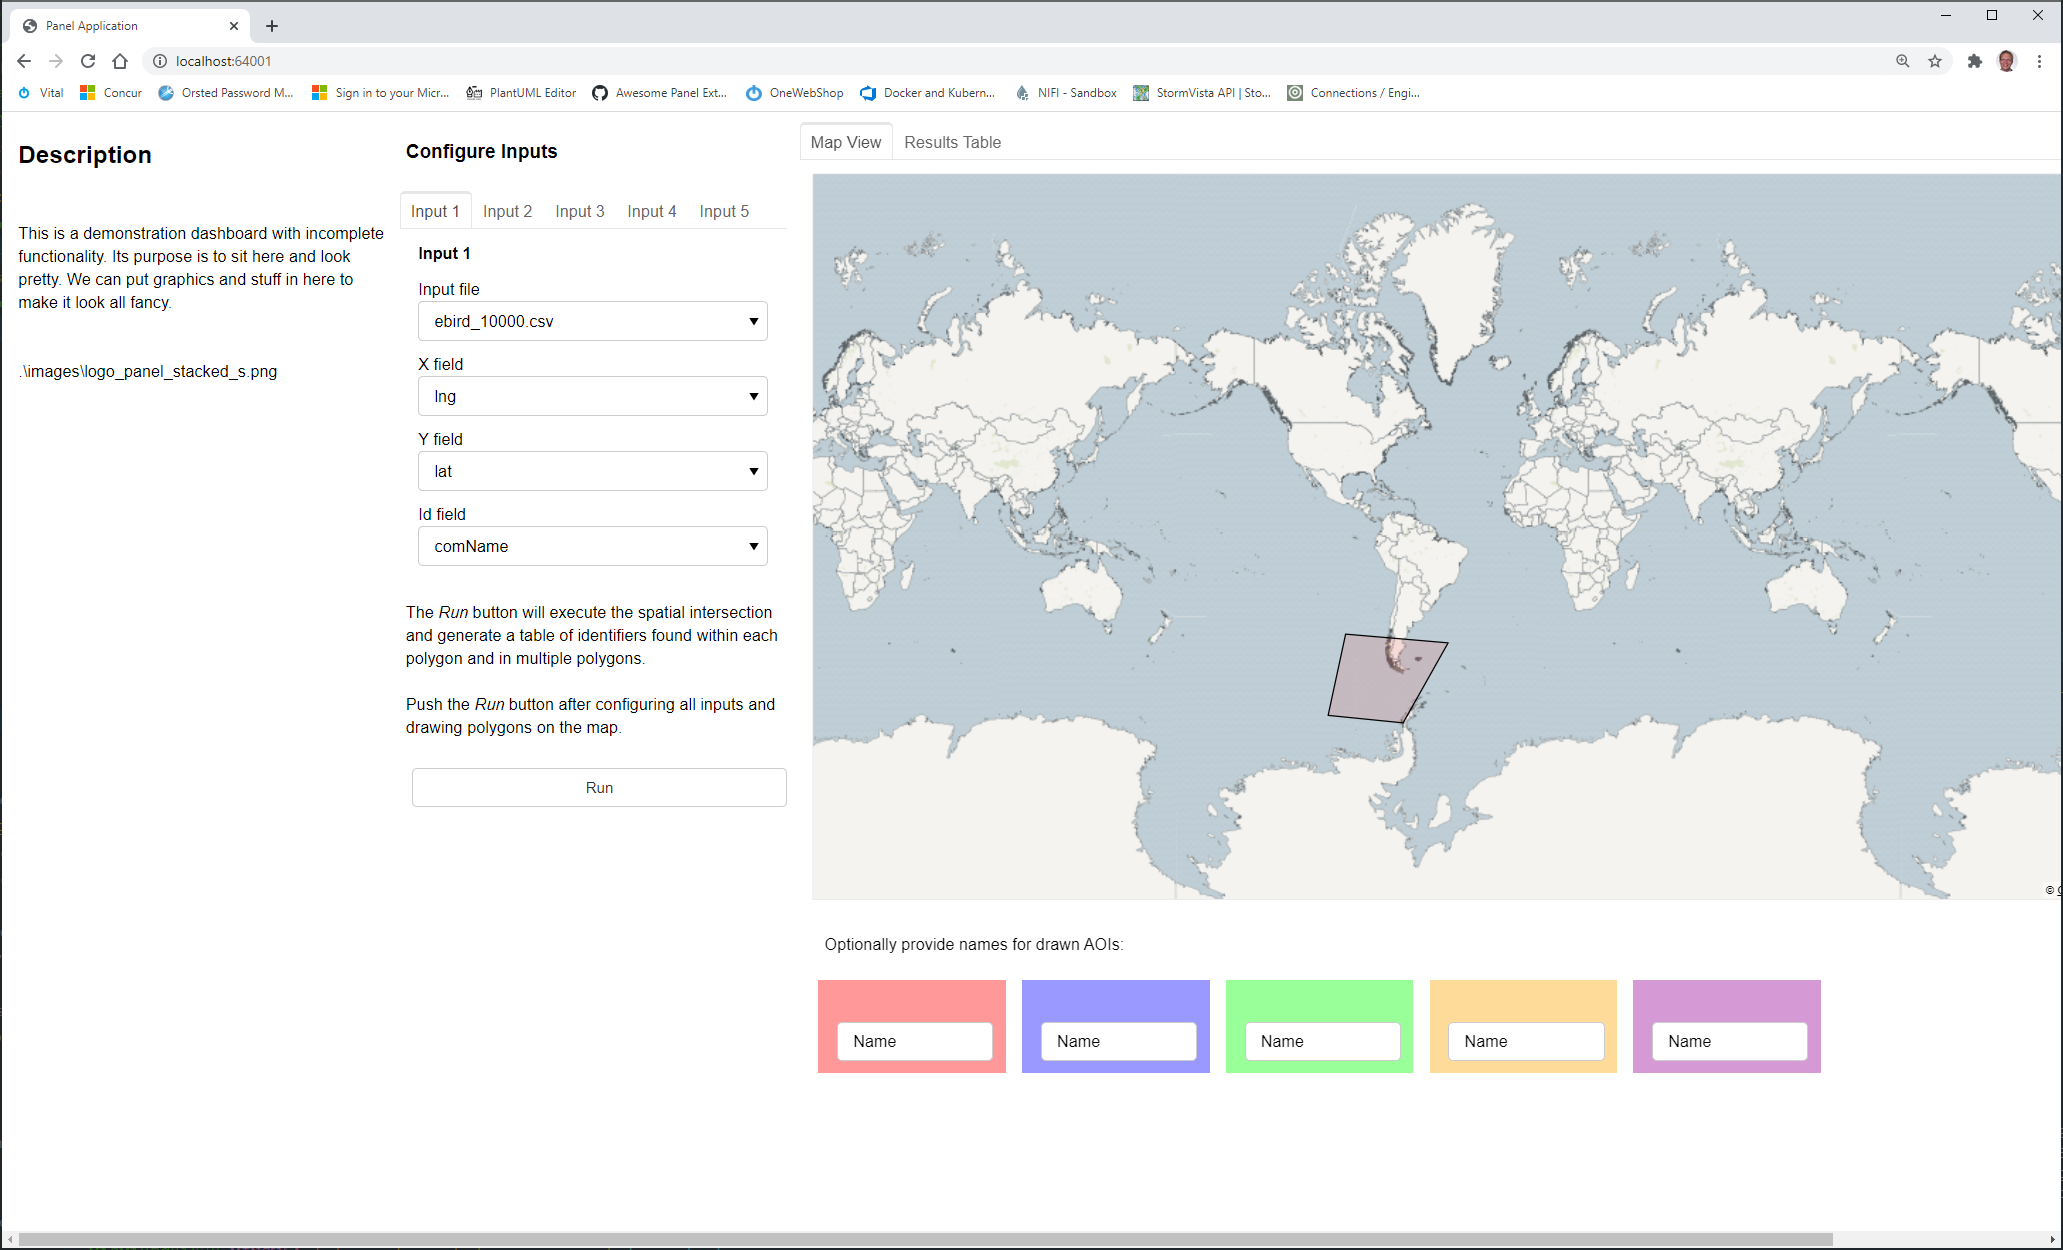
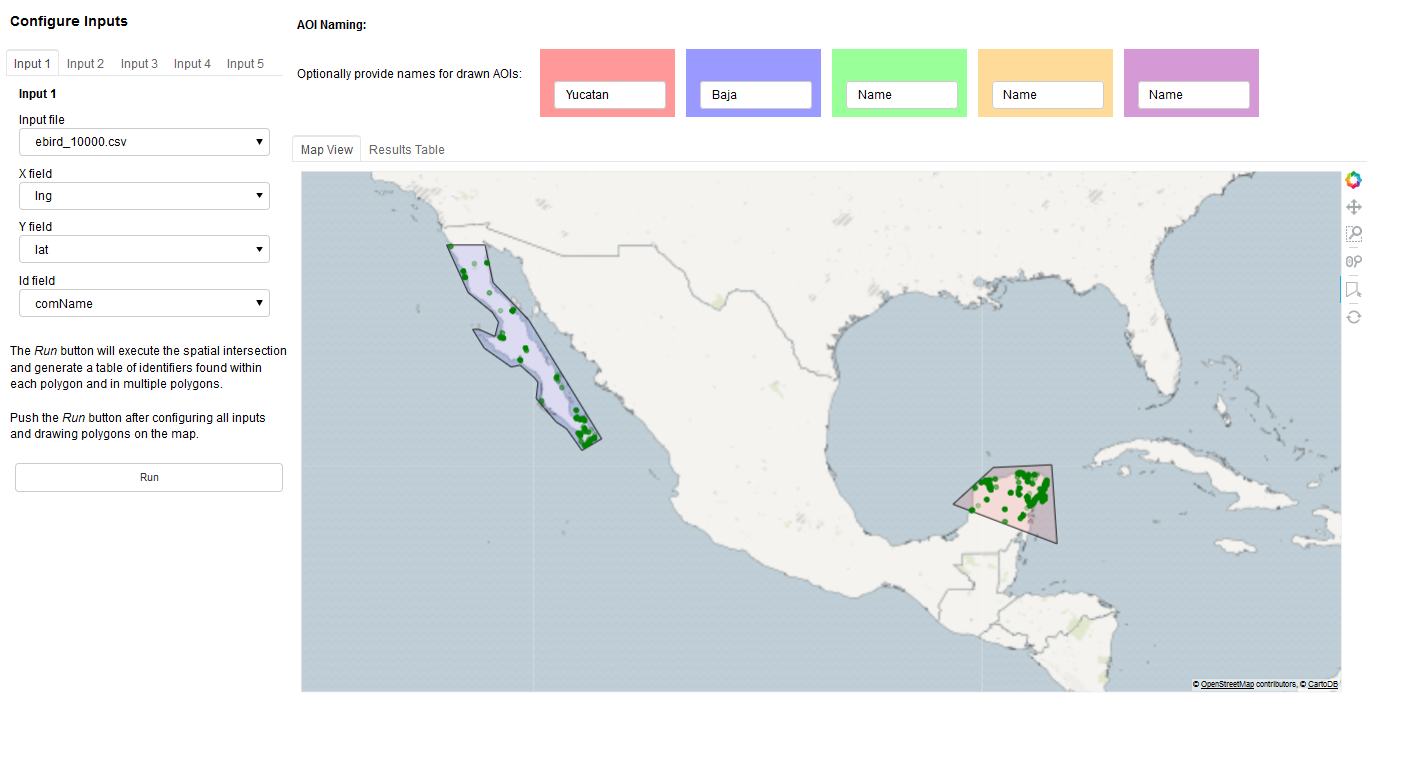
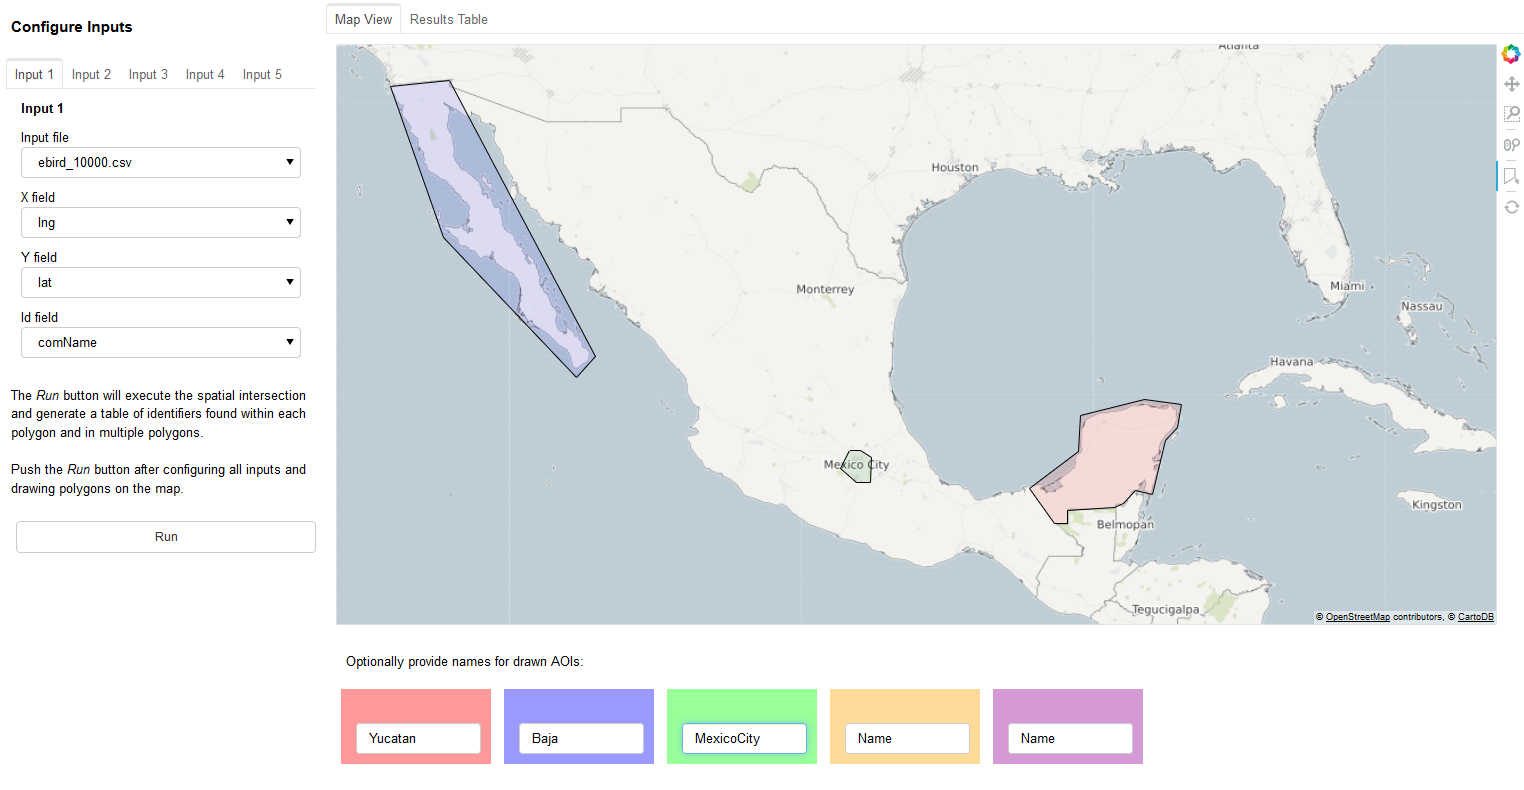
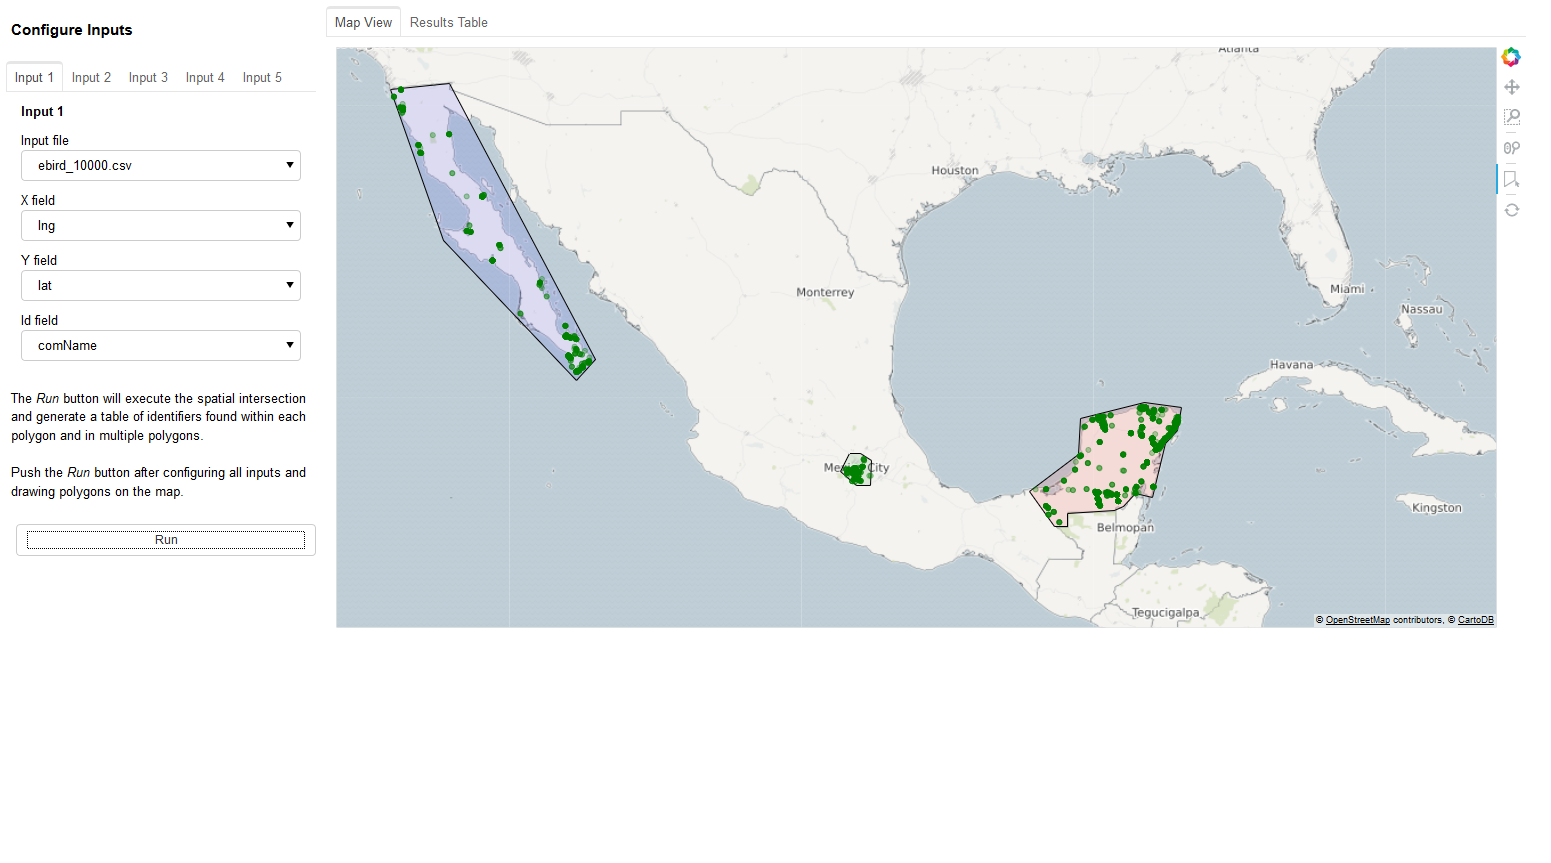
I’ve made an app which so far works very well. The user can configure some input file settings, draw polygons on the map, and the drawn polygons are used as geographic extents to retrieve intersecting points from the user’s input file(s). It looks like this.
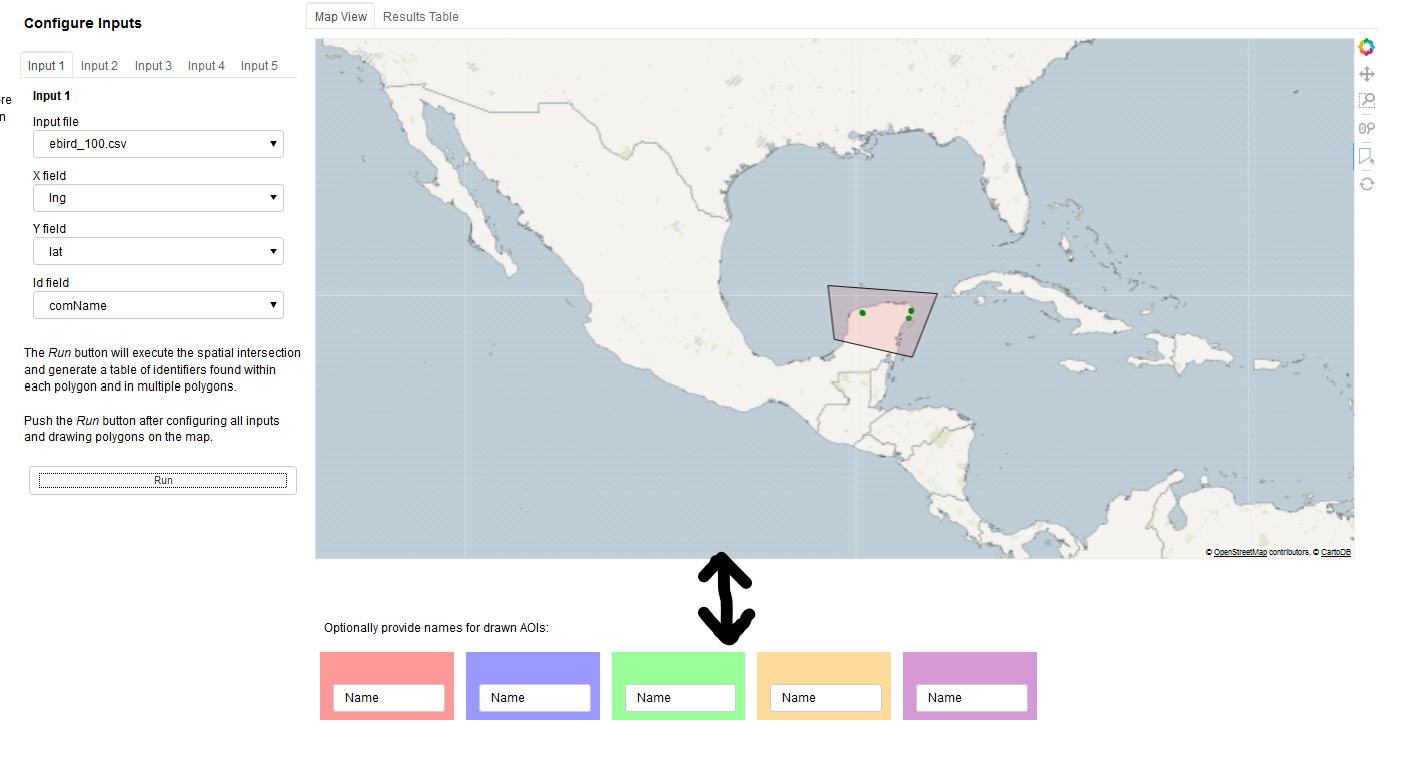
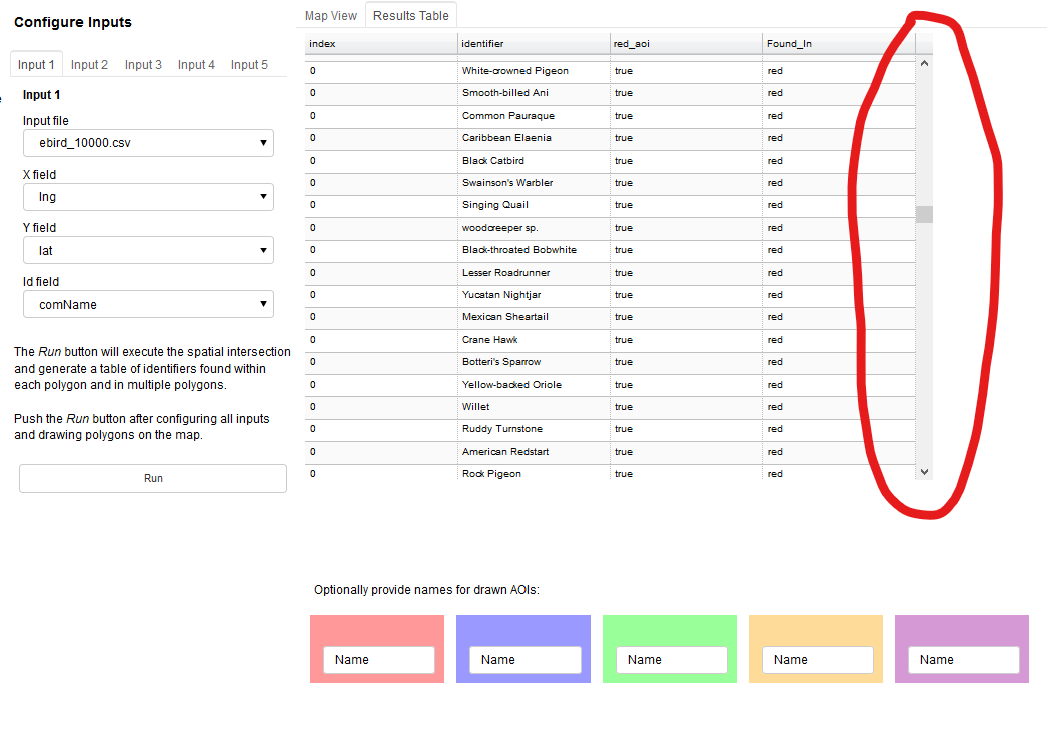
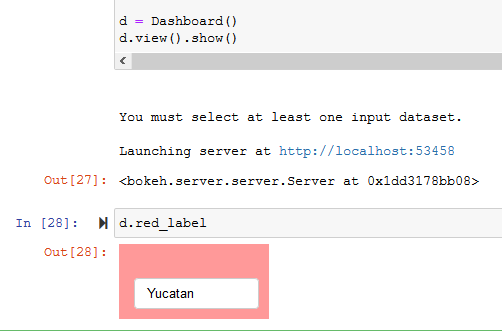
At the bottom you can see some colour text inputs which are param.String() wrapped in panel.Row. I want these to remain permanently on the page, however, when the function triggered by the Run button is called the coloured text boxes disappear while the remaining elements remain. After pushing Run the app looks like this.
Can someone explain to me why those text boxes are being removed, and how to prevent them from being removed? The objects persist in the Python kernel and their state is preserved; I can go to the Jupyter Notebook and do this to see that the object exists and the text value I entered persists:
The following code is a working example which demonstrates the issue when run in a Jupyter Notebook.
…it’s a big blob of code, for which I apologize, however, most responses on this forum begin with “Please post a working example” so I figured I’d start with that. Thanks in advance to anyone who takes a look.
Running it will require a sample input file be placed in a folder called sample_data\ in the same directory as the notebook. This file can be used for testing: ebird_10000.csv (1.5 MB)
import panel as pn
import param
import geoviews as gv
import holoviews as hv
import pandas as pd
import geopandas as gpd
from datashader.utils import lnglat_to_meters
from shapely.geometry import Point, Polygon
from cartopy import crs

gv.extension('bokeh',logo=False)
pn.extension()


class Inputs(param.Parameterized):

    input_file = param.FileSelector(path='.\sample_data\*.csv', doc='A .csv file selector for input data')
    x_field    = param.Selector(doc='A field selector for longitude')
    y_field    = param.Selector(doc='A field selector for latitude')
    id_field   = param.Selector(doc='A field selector for the identifier')
    data       = None

    @param.depends('input_file', watch=True)
    def update_inputs(self):

        df                          = pd.read_csv(self.input_file)
        numeric_cols                = list(df.select_dtypes(include=['float64']).columns)
        columns                     = [x for i,x in enumerate(df.columns) if x !='Unnamed: 0']
        self.param.x_field.objects  = numeric_cols
        self.x_field                = numeric_cols[0]
        self.param.y_field.objects  = numeric_cols
        self.x_field                = numeric_cols[0]
        self.param.id_field.objects = columns
        self.id_field               = columns[0]
        self.data                   = df


class Mapview(param.Parameterized):

    tiles         = gv.tile_sources.CartoEco()
    aoi_polygons  = gv.Polygons([], crs=crs.GOOGLE_MERCATOR)
    aoi_colours   = ['red','blue','green','orange','purple']
    aoi_stream    = hv.streams.PolyDraw(source=aoi_polygons, num_objects=5,styles={'fill_color': aoi_colours})
    template_df   = pd.DataFrame({'lng': [], 'lat': []}, columns=['lng', 'lat'])
    dfstream      = hv.streams.Buffer(template_df, index=False, length=10000, following=False)
    points        = hv.DynamicMap(gv.Points, streams=[dfstream])
    map_layout    = tiles * aoi_polygons * points

    def show_map(self):
        # set style options on map_layout
        self.map_layout.opts(
            # the ratio of WMTS height:width must be eqaul to the data_aspect value (0.5)
            # or the map will stretch/skew
            gv.opts.WMTS(global_extent=True,width=1200,height=600,show_grid=False,xaxis=None,yaxis=None),
            gv.opts.Polygons(fill_alpha=0.1),
            gv.opts.Points(size=5, color='green', fill_alpha=0.3, line_alpha=0.4)
        )
        return self.map_layout.opts(data_aspect=0.5)


class Aoi(param.Parameterized):
    aoi = param.String('Name')

    def set_aoi_textbox_style(self, row, color='rgba(0,0,0,0)'):
        row.background = color
        row.objects[0][0].value = ''
        row.objects[0][1].name = ''
        row.objects[0].width = 145


class Dashboard(param.Parameterized):

    input1    = Inputs()
    input2    = Inputs()
    input3    = Inputs()
    input4    = Inputs()
    input5    = Inputs()
    mapview   = Mapview()

    run_button = param.Action(lambda x: x.param.trigger('run_button'), label='Run')

    # create colour-coded text input boxes to allow the user to optionally provide names for
    # the AOIs drawn on the map

    aois = []

    red = Aoi()
    red_label = pn.Row(red, width=150)
    red.set_aoi_textbox_style(red_label, 'rgba(255,0,0,0.4)')
    aois.append(red_label)

    blue = Aoi()
    blue_label = pn.Row(blue, width=150)
    blue.set_aoi_textbox_style(blue_label, 'rgba(0,0,255,0.4)')
    aois.append(blue_label)

    green = Aoi()
    green_label = pn.Row(green, width=150)
    green.set_aoi_textbox_style(green_label, 'rgba(0,255,0,0.4)')
    aois.append(green_label)

    orange = Aoi()
    orange_label = pn.Row(orange, width=150)
    orange.set_aoi_textbox_style(orange_label, 'rgba(255,165,0,0.4)')
    aois.append(orange_label)

    purple = Aoi()
    purple_label = pn.Row(purple, width=150)
    purple.set_aoi_textbox_style(purple_label, 'rgba(150,0,150,0.4)')
    aois.append(purple_label)

    def show_aoi_gui(self):

        return pn.Row(pn.Spacer(width=5),
                      self.red_label,pn.Spacer(width=3),
                      self.blue_label,pn.Spacer(width=3),
                      self.green_label,pn.Spacer(width=3),
                      self.orange_label,pn.Spacer(width=3),
                      self.purple_label,pn.Spacer(width=3))

    """While Geoviews will automatically project coordinates in degrees into meters to
    match the coordinate system of the WMTS object, the Geopandas.GeoDataFrame.intersects()
    method employed in the run_analysis() function requires the point coordinates to have
    the same coordinates as the polygon geometries. Therefor the point coordinates must be projected
    to web mercator (epsg:3857)"""
    def project_to_meters(self, df, x, y):
        try:
            df.loc[:,'x_meters'], df.loc[:,'y_meters'] = lnglat_to_meters(df[x],df[y])
            geometry = [Point(xy) for xy in zip(df.x_meters, df.y_meters)]
            web_merc = {'init': 'epsg:3857'}
            return gpd.GeoDataFrame(df, crs=web_merc, geometry=geometry)
        except:
            print("""Could not project specified coordinate fields to meters. Make sure the X Field and Y Field
                  values have been set correctly.\n""")


    @param.depends('run_button')
    def run_analysis(self):
        try:
            # clear previous results
            self.mapview.dfstream.clear()

            # Convert each input into a GeoDataFrame and project coordinates to meters
            datasets  = []
            id_fields = []
            for i in [self.input1, self.input2, self.input3, self.input4, self.input5]:
                if isinstance(i.data, pd.core.frame.DataFrame):
                    gdf = self.project_to_meters(i.data, i.x_field, i.y_field)
                    datasets.append(gdf)
                    id_fields.append(i.id_field)

            if len(datasets)>0:
                # Convert polygons drawn on the map into Shapely polygon geometries
                poly_data = d.mapview.aoi_stream.data
                polygons = []
                for r in range(len(poly_data['xs'])):
                    xs = poly_data['xs'][r]
                    ys = poly_data['ys'][r]
                    vertices = list(zip(xs,ys))
                    polygons.append(Polygon(vertices))

                # Do intersections of each polygon on each GeoDataFrame & send results to the map
                df_all_polys = pd.DataFrame()
                df_final = pd.DataFrame()
                poly_labels = []

                for i in range(len(datasets)):
                    for p in polygons:
                        # if the user does not specify a name for the aoi, use
                        # the colour as the name
                        if (self.aois[polygons.index(p)].objects[0][1].value == 'Name'):
                            poly_label = self.mapview.aoi_colours[polygons.index(p)] + '_aoi'
                        # else use the name provided by the user
                        else:
                            poly_label = self.aois[polygons.index(p)].objects[0][1].value + '_user_provided'
                        poly_labels.append(poly_label)
                        datasets[i][poly_label] = datasets[i].intersects(p)
                        selected = datasets[i].loc[datasets[i][poly_label]==True].drop(columns='geometry')
                        self.mapview.dfstream.send(pd.DataFrame(selected[['lng','lat']]))
                        selected.rename(columns={id_fields[i]:'identifier'},inplace=True)
                        df_all_polys = pd.concat([df_all_polys,selected[['identifier',poly_label]]],axis=0,ignore_index=True)

                for ident in pd.unique(df_all_polys['identifier']):
                    dfx = df_all_polys.loc[df_all_polys['identifier']==ident]
                    poly_values = {'identifier':[ident]}
                    for label in poly_labels:
                        # returns true if any of the values are true
                        poly_values[label] = [dfx[label].any()]
                    df_ident = pd.DataFrame.from_dict(poly_values)
                    df_final = pd.concat([df_final, df_ident],axis=0)

                def summarize_polys(row):
                    cols = list(row.axes[0])
                    s = []
                    for c in cols:
                        if '_aoi' in c:
                            if row.values[cols.index(c)]:
                                s.append(c.split('_aoi')[0])
                        if '_user_provided' in c:
                            if row.values[cols.index(c)]:
                                s.append(c.split('_user_provided')[0])
                    return ','.join(s)

                summary = df_final.copy()

                try:
                    summary['Found_In'] = summary.apply(lambda row: summarize_polys(row),axis=1)
                    # remove the '_user_provided' flag from column names where it exists
                    for col in summary.columns.to_list():
                        if '_user_provided' in col:
                            summary.rename(columns={col : col.split('_user_provided')[0]}, inplace=True)

                    return pn.widgets.DataFrame(summary, disabled=True, fit_columns=True, width=700)

                except:
                    print('There was an error creating the final output summary table.\n')

            else:
                print('You must select at least one input dataset.\n')

        except:
            print('Something went wrong in the run_analysis() function.\n')
            # show the message in the Table View tab of the dashboard
            return('Something went wrong in the run_analysis() function.')


    def view(self):

        desc = """This is a demonstration dashboard with incomplete functionality. Its purpose
        is to sit here and look pretty. We can put graphics and stuff in here to
        make it look all fancy."""

        logo = '.\images\logo_panel_stacked_s.png'

        button_desc = """The <i>Run</i> button will execute the spatial intersection and generate
        a table of identifiers found within each polygon and in multiple polygons.<br><br>
        Push the <i>Run</i> button after configuring all inputs and drawing polygons on the map."""

        return pn.Row(
                pn.Column(
                    '## Description',
                    desc,logo),
                pn.Column(
                    '### Configure Inputs',
                    pn.Tabs(
                        ('Input 1',self.input1),
                        ('Input 2',self.input2),
                        ('Input 3',self.input3),
                        ('Input 4',self.input4),
                        ('Input 5',self.input5)),
                    button_desc,
                    self.param['run_button']),
                pn.Column(pn.Tabs(
                        ('Map View', self.mapview.show_map),
                        ('Results Table', self.run_analysis)),
                        pn.Column(
                            pn.Row(pn.Spacer(width=5),'Optionally provide names for drawn AOIs:'),
                            self.show_aoi_gui
                        )))

d = Dashboard()
d.view().show()```