Posting this here because I’m not sure where the bug lies. I suspect Panel’s interaction with Bokeh is the problem.
import holoviews as hv
import pandas as pd
import numpy as np
import panel as pn
import hvplot.pandas
from holoviews.streams import Selection1D
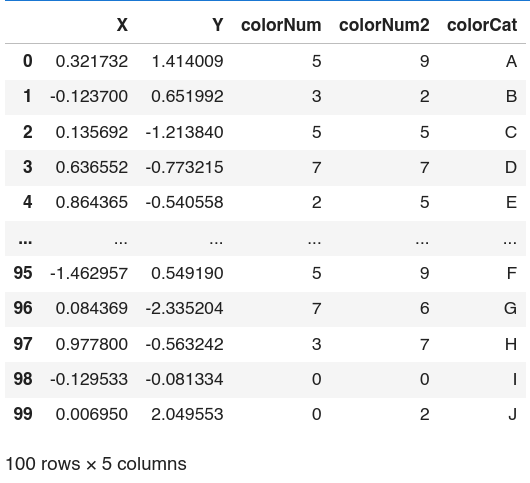
data = {'X' : np.random.randn(100),
'Y' : np.random.randn(100),
'colorNum' : np.random.randint(0,10,100),
'colorNum2' : np.random.randint(0,10,100),
'colorCat' : list('ABCDEFGHIJ')*10}
df = pd.DataFrame(data)
df
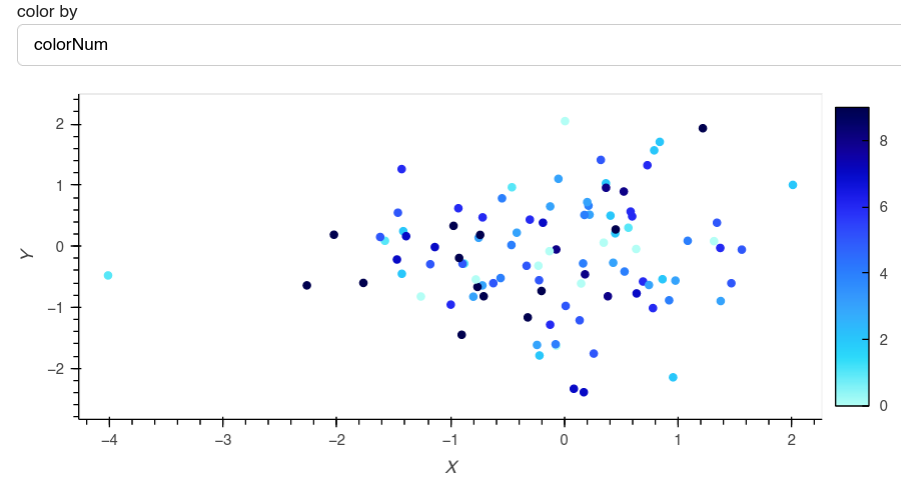
Plotting this and switching between the two numerical columns works fine:
color_by_select = pn.widgets.Select(name='color by', options=['colorNum', 'colorNum2', 'colorCat'], value='colorNum')

def points(ds, colorby):
    return ds.data.hvplot.points(x='X', y='Y', color=colorby)

pn.Column(color_by_select,
          hv.Dataset(df).apply(points, colorby=color_by_select))
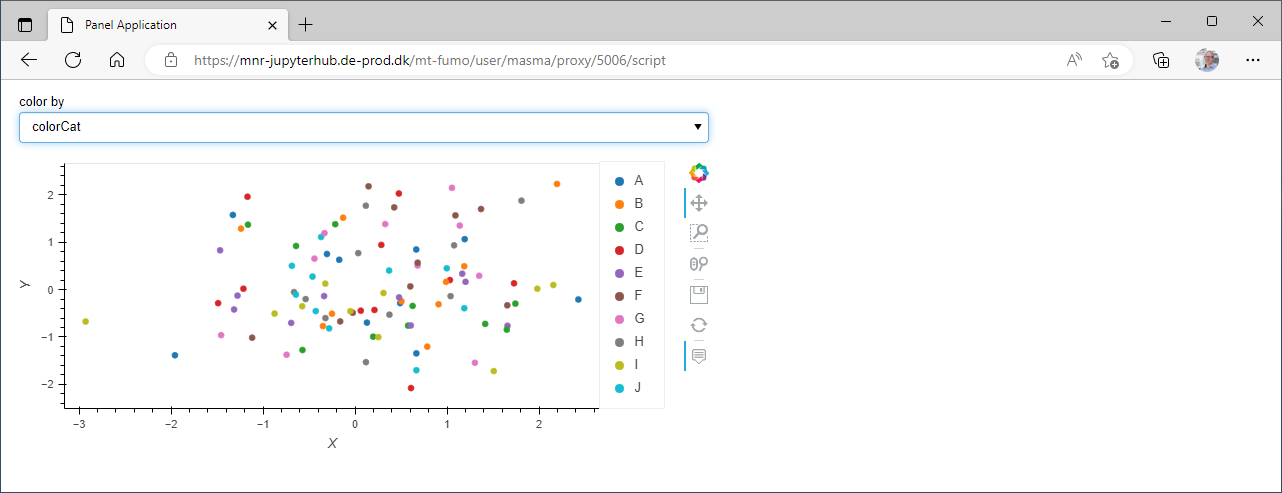
But a long error message is produced if I try to switch to coloring by colorCat:
Traceback (most recent call last):
  File "/home/popos/miniconda3/envs/maple/lib/python3.8/site-packages/holoviews/plotting/bokeh/element.py", line 1446, in _update_glyphs
    style = self._apply_transforms(element, data, ranges, style)
  File "/home/popos/miniconda3/envs/maple/lib/python3.8/site-packages/holoviews/plotting/bokeh/element.py", line 1136, in _apply_transforms
    cmapper = self._get_colormapper(v, element, ranges,
  File "/home/popos/miniconda3/envs/maple/lib/python3.8/site-packages/holoviews/plotting/bokeh/element.py", line 1922, in _get_colormapper
    opts = {k: opt for k, opt in opts.items()
  File "/home/popos/miniconda3/envs/maple/lib/python3.8/site-packages/holoviews/plotting/bokeh/element.py", line 1923, in <dictcomp>
    if getattr(cmapper, k) != opt}
  File "/home/popos/miniconda3/envs/maple/lib/python3.8/site-packages/bokeh/core/has_props.py", line 264, in __getattr__
    self._raise_attribute_error_with_matches(name, properties)
  File "/home/popos/miniconda3/envs/maple/lib/python3.8/site-packages/bokeh/core/has_props.py", line 272, in _raise_attribute_error_with_matches
    raise AttributeError(f"unexpected attribute {name!r} to {self.__class__.__name__}, {text} attributes are {nice_join(matches)}")
AttributeError: unexpected attribute 'factors' to LinearColorMapper, possible attributes are domain, high, high_color, js_event_callbacks, js_property_callbacks, low, low_color, name, nan_color, palette, subscribed_events, syncable or tags
Any way around this other than manually adding colors to a new column? If I have to do that, what would be the fastest way? Like could I just do essentially what Bokeh is doing in the backend but manually somehow?
Happy to repost this somewhere else if that would be better
Thanks