Hi there 
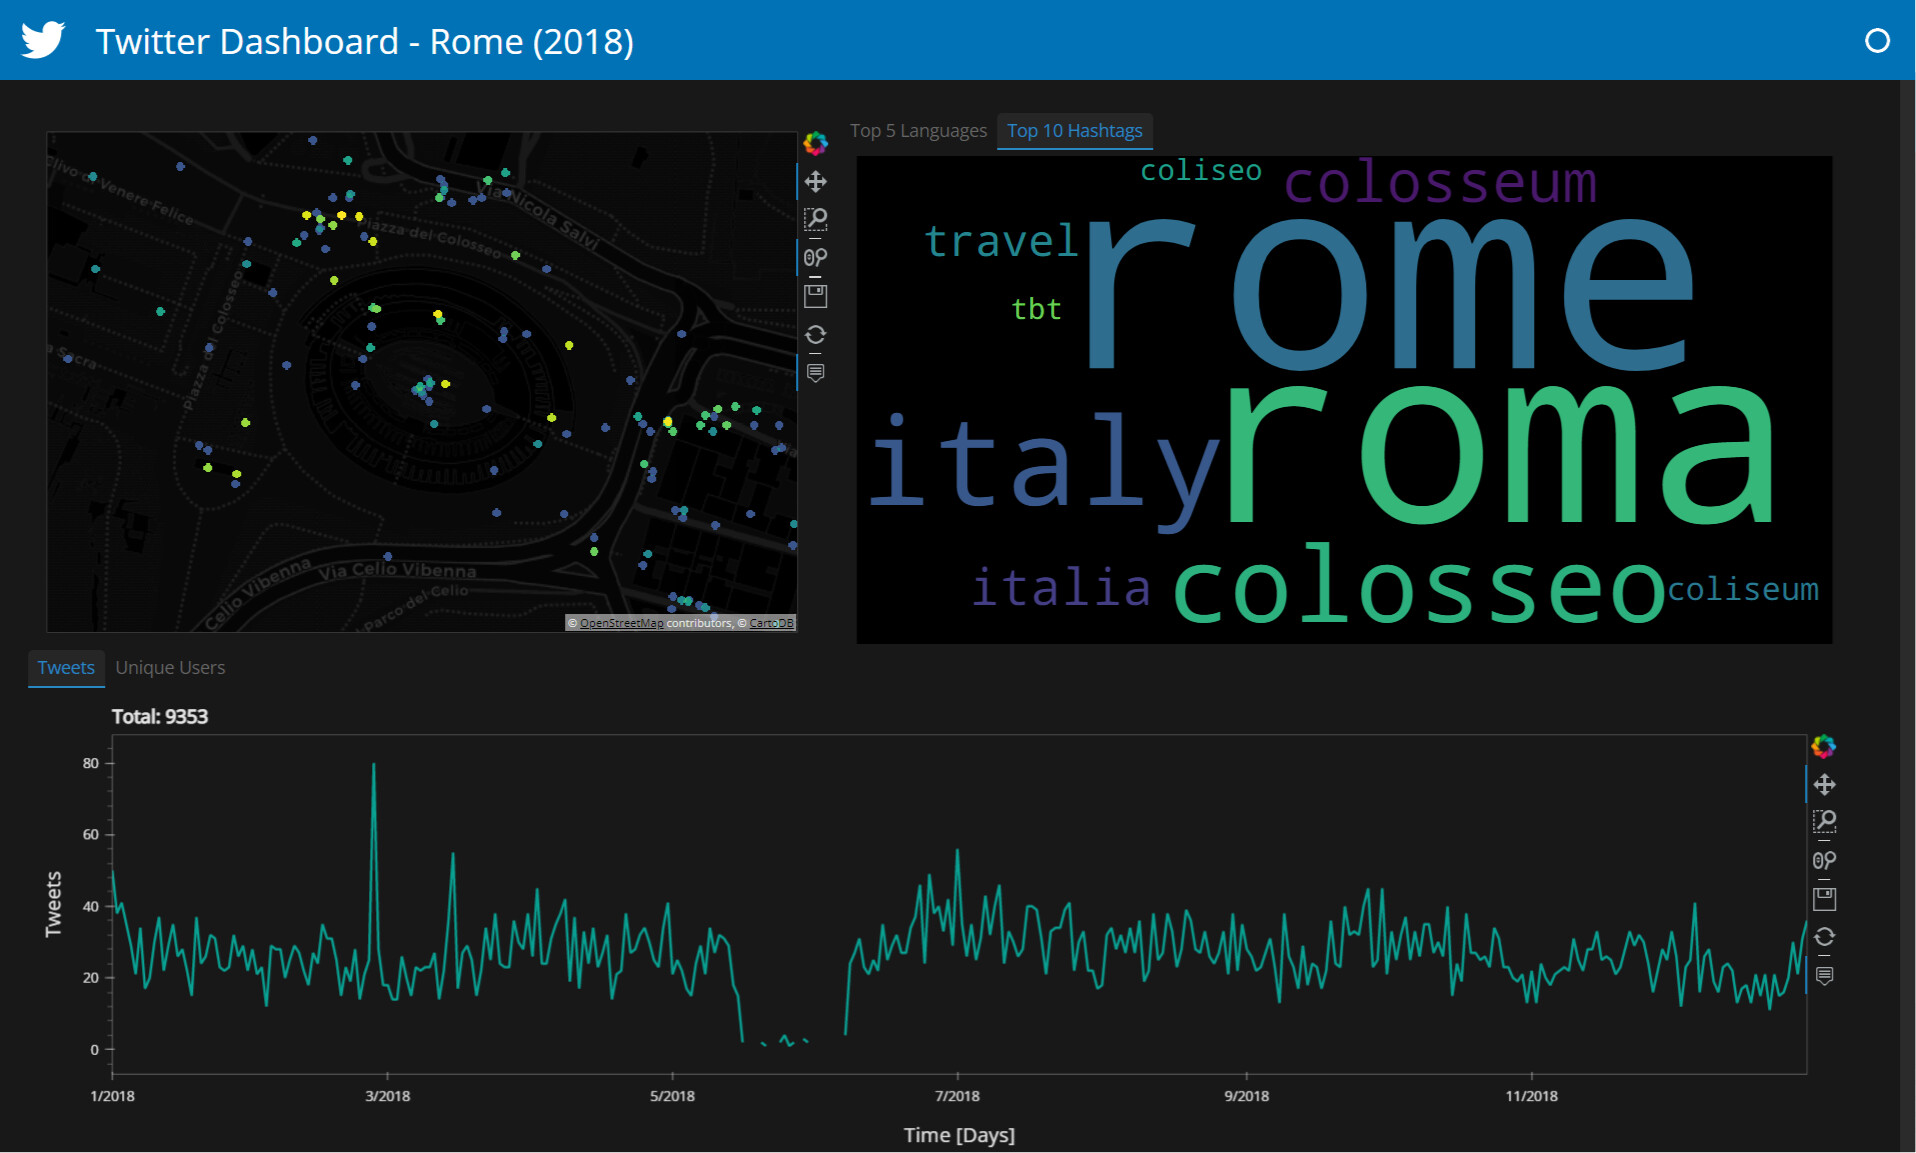
I share the source code of my first Panel-based dashboard that I built to explore Twitter geotagged  data of the Historic Centre of Rome:
The dashboard in action!!! 
 Known issues:
- The tweet map deforms along the N-S axis when you hit the reset button;
 To-Do:
- Hide the -NaN values in the tweet map hover;
- Fit the word cloud image to the pn.pane.Matplotlib without specifying the width/height;
- Deploy the app;
Hit a  if you like it!
9 Likes
Marc
2
I really like it. Would it be ok to share on … twitter? 
1 Like
Thanks! I’ve also shared on Twitter.
1 Like
Good evening,
I’ve updated this dashboard Link: GitHub - ivandorte/panel-geodashboard-twitter: A simple Panel-based dashboard visualizing geotagged tweets with hvplot and Datashader.
Misc improvements:
- Changed MaterialTemplate to FastListTemplate;
- Replaced pn.pane.Matplotlib with pn.pane.SVG in top 10 Hashtags plot;
- Removed numeric indicators;
- Removed interpolation for missing data;
- Improved map visualization;
4 Likes