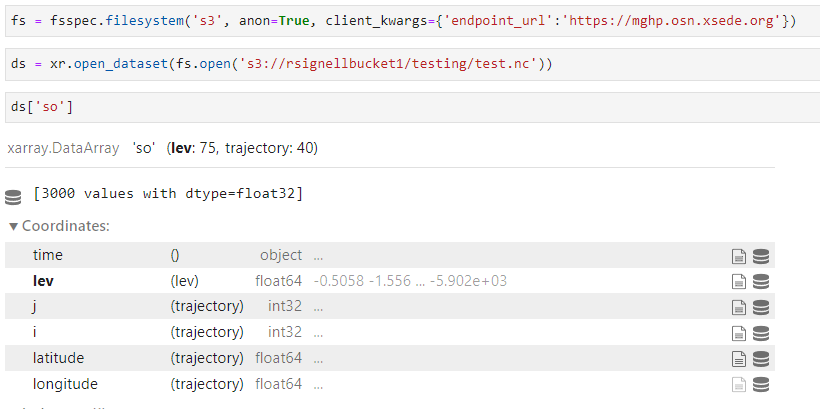
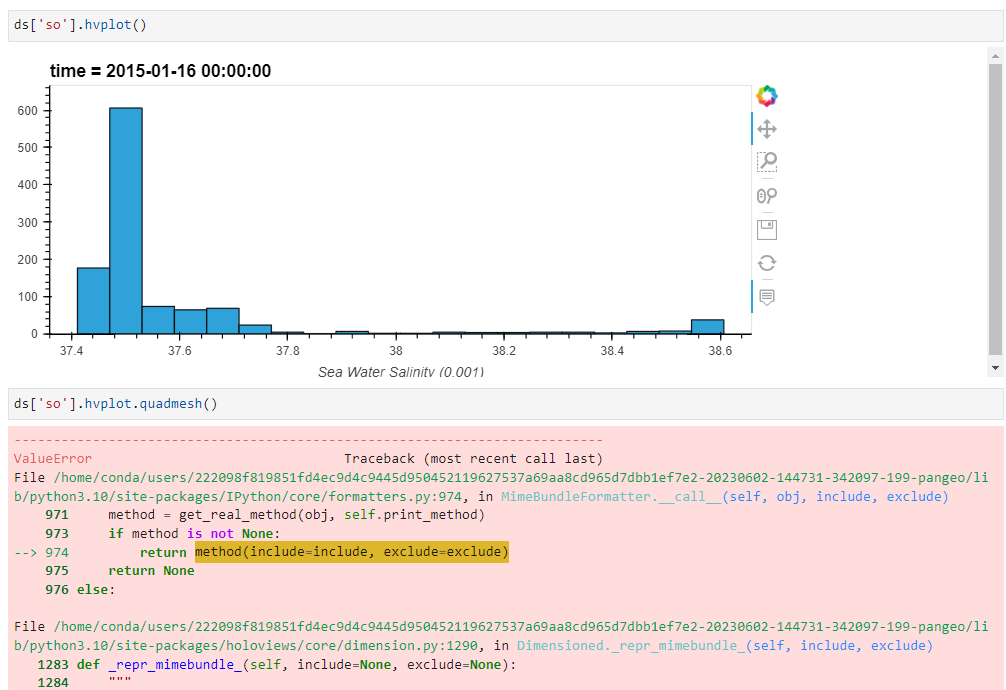
I’m exploring CMIP6 climate data (part of the Pangeo project) and having an issue displaying a vertical section of ocean salinity data. After extracting the section using xoak (very cool), I can plot the surface values nicely with hvplot:
and the vertical section plots nicely with Matplotlib .plot():
but not with .hvplot():
Here’s the full reproducible notebook (no credentials required!)
How can I make .hvplot() function like .plot() for this example?
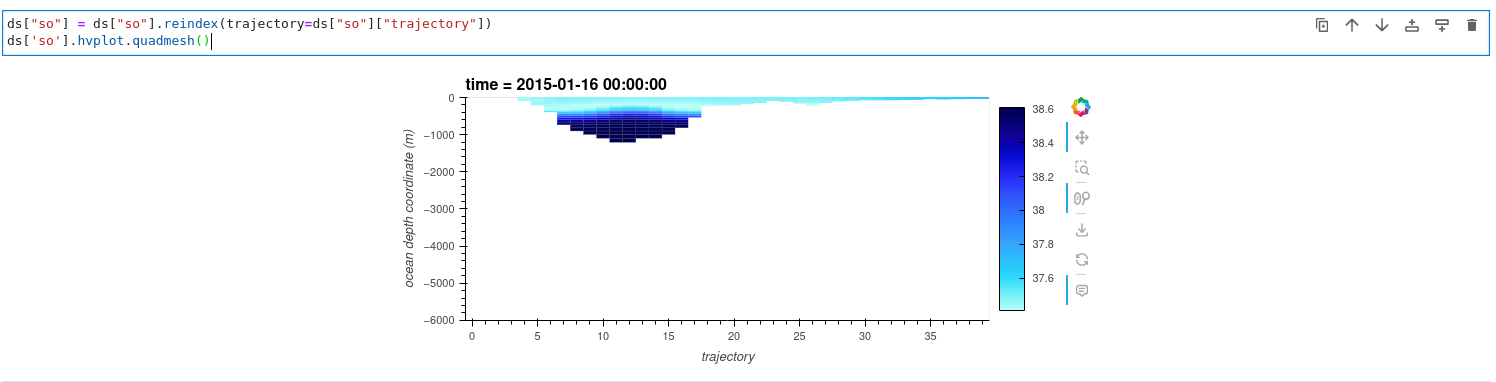
It seems like the trajectory is not part of the index, which breaks the logic in Holoviews. By adding it to the index, we can get the desired output: ds["so"] = ds["so"].reindex(trajectory=ds["so"]["trajectory"])
Note to myself: This is what happens behind the scene (hv.Dataset(ds['so']).to(hv.QuadMesh))
Awesome! Thanks @Hoxbro !
For some reason my updated notebook isn’t showing the hvplot on nbviewer, but here’s a screen grab to show it working alongside the .plot command:
P.S. I’m currently a visiting scientist at an organization where I’ve been giving some clinics the last few weeks on the “pangeo” platform, (dask/xarray/hvplot) and I was going to use my question as an example of how to ask for help. And during the clinic, we saw that you had already answered! The attendees were indeed impressed! 
3 Likes