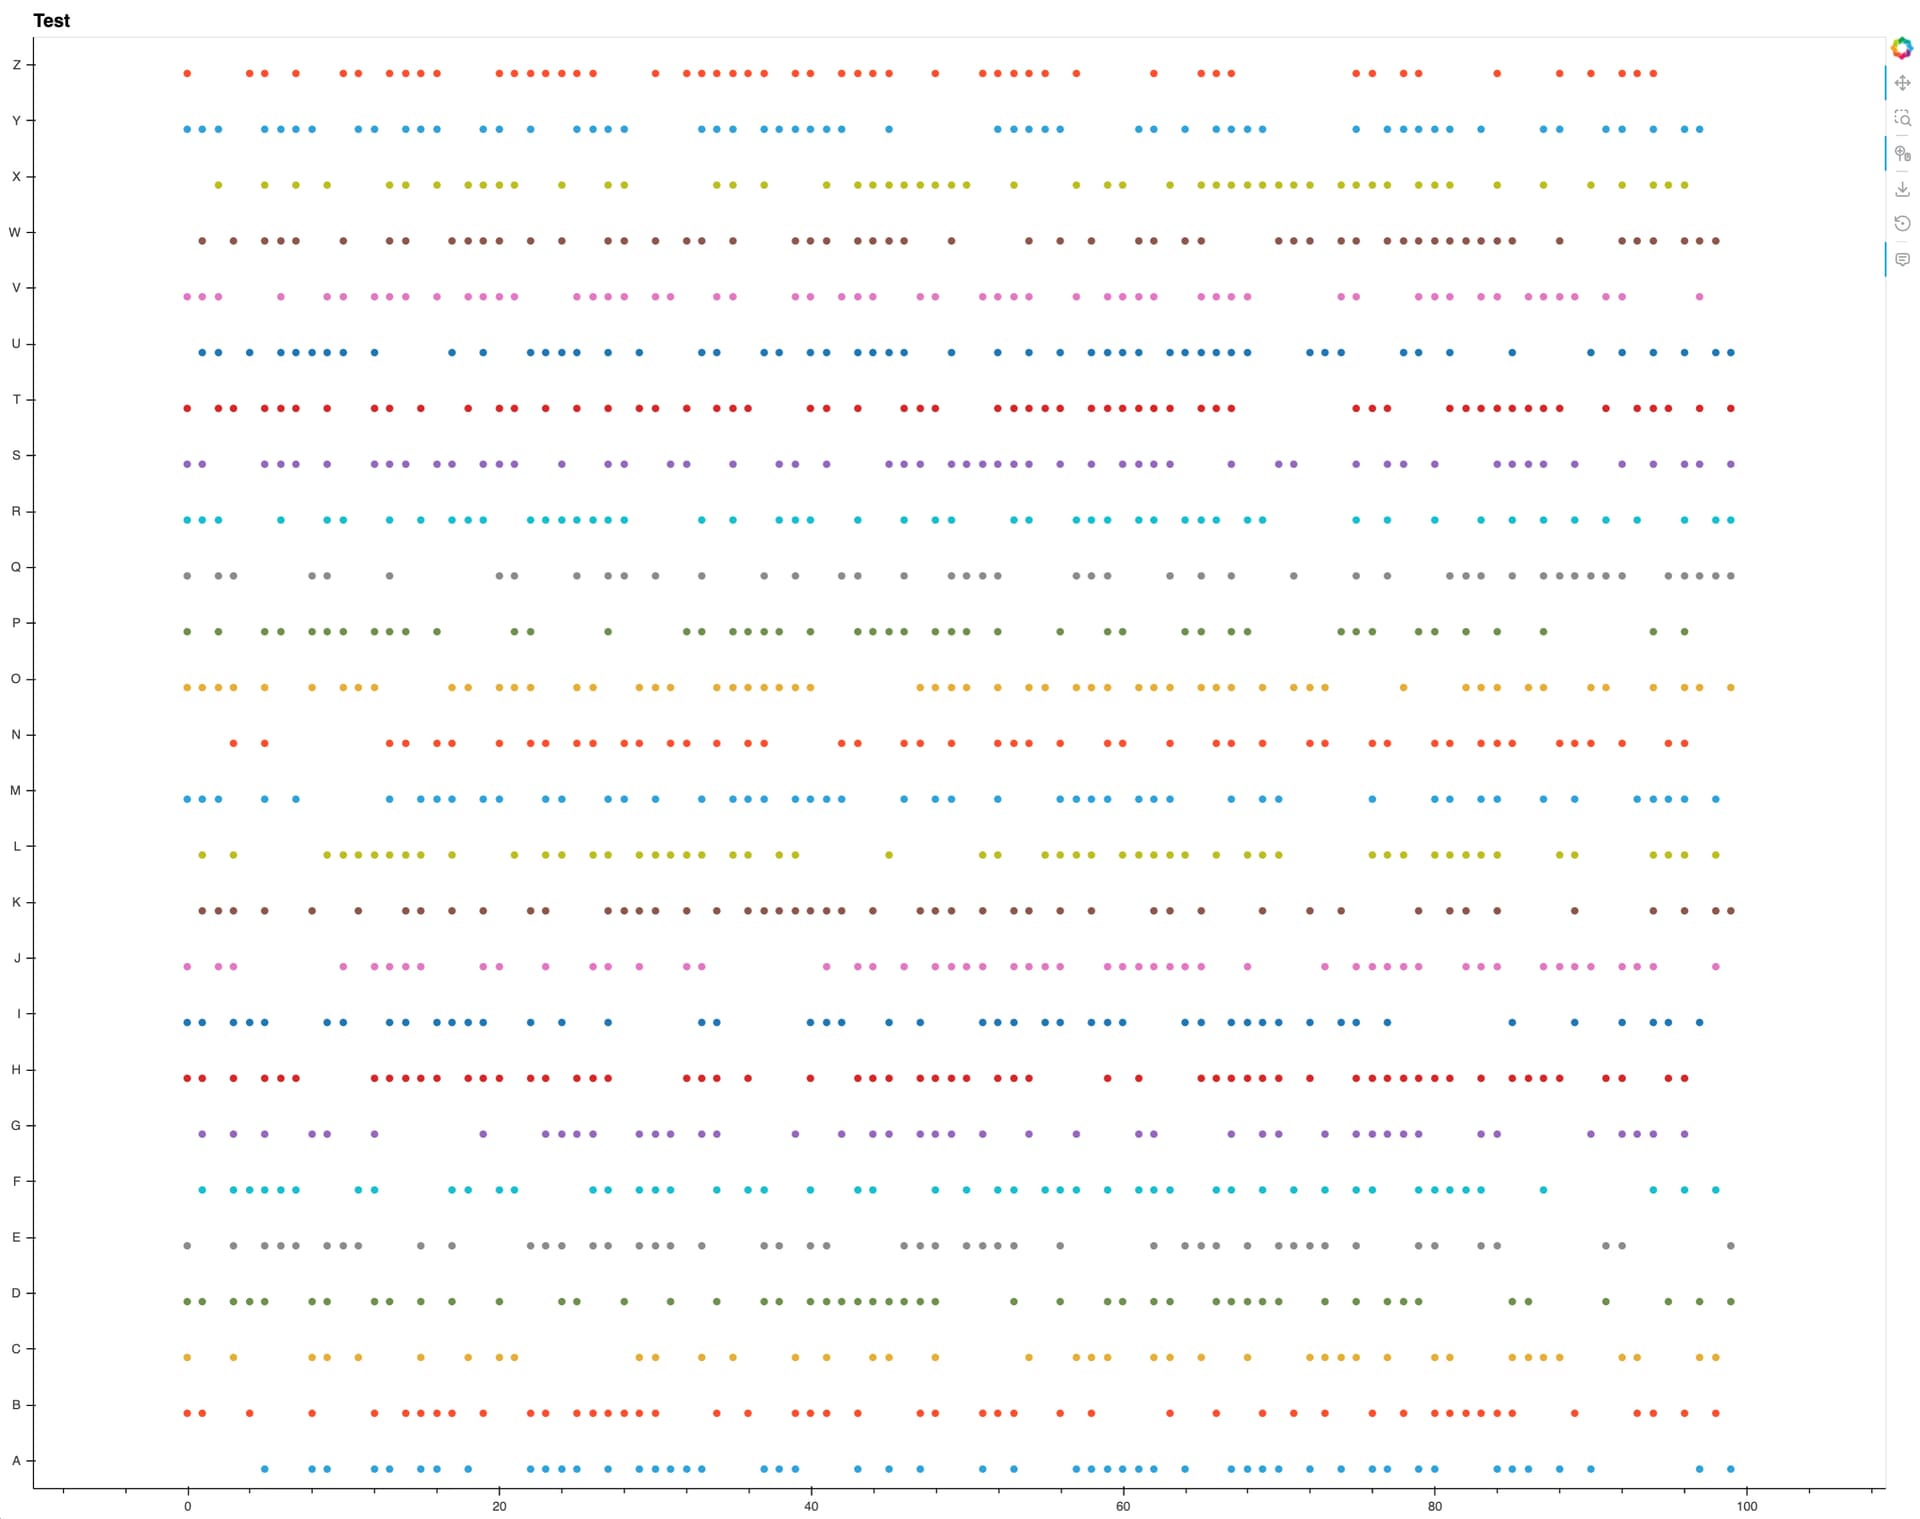
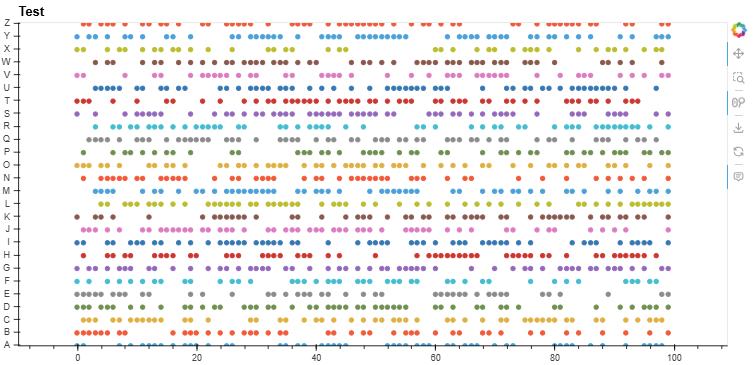
I can’t get one of my (hv)plots to pad the y axis to allow for the top and bottom columns from the df to be away from the border
Here is an MRE.
import numpy as np
import pandas as pd
import hvplot.pandas # noqa
import panel as pn

df = pd.DataFrame(np.random.randint(0,2,size=(100, 26)), columns=list('ABCDEFGHIJKLMNOPQRSTUVWXYZ'))


for col in df.columns:
     df[col] = np.where(df[col] == 1, col, "")


plot = df.hvplot.scatter(framewise=True,
                    shared_axes=False,
                    subcoordinate_y={"subcoordinate_scale": 0.1},
                    title="Test",
                    padding=(0.1, 0.75),
                    responsive=True,
                   legend=False,)

pn.Row(plot).show()
If someone has a better idea of how to plot on / off, 0 / 1, go / no go values without the numpy where and subcoordinate parts please let me know?