Hello HoloViz/GeoViews/Panel-ers,
This is my first project using HoloViz - really impressed by how powerful it is. I am working on building the first of several dashboards to visualize geospatial and timeseries data related to streamflow forecasts and the models/datasets that generate them.
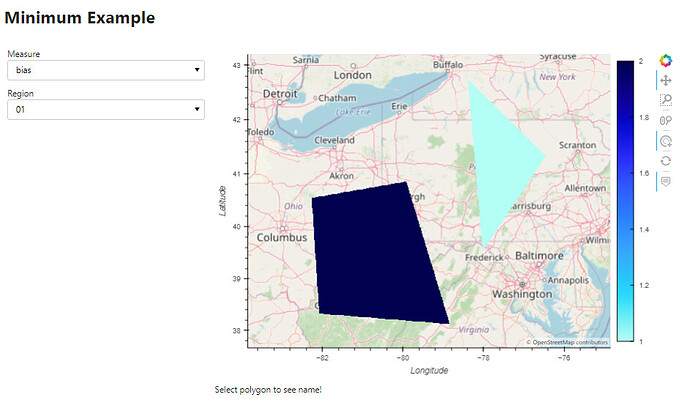
I have made some good progress getting the behavior I want but seem to be stuck on one aspect. On the map component a user can visualize different measures in different geographic regions based on user selected parameters in dropdowns, then, if a user selects (clicks) a polygon, they are shown additional information about that area (just the polygon name in this example). When the users chooses a different measure, I don’t want the map extents to change (they don’t in my example), but when a user chooses a different region, I want the map to zoom to the new region (it doesn’t in my example).
I created a simple working example that has the major parts that my first dashboard will have, but simplified to demonstrate the issue I am having (see link below for notebook). Basically, when a user selects region “18” from the drop down, I want it to zoom to the newly drawn polygons (in CA), but when the user selects a new measure, I don’t want the zoom level to change. I have tried playing xlim/ylim but don’t seem to be able to figure out how I would trigger/apply that if I were to take the route. I am having difficulty understanding how all the pieces of the HoloViz ecosystem fit together and would really appreciate any feedback/thoughts/things to try.
I suspect the solution my fall in this chunk of code, so I posted directly in the post, but a working notebook is attached.
measure_selector = get_measure_selector()
huc_selector = get_huc_selector()

catchment_polygons = pn.bind(
    get_catchments,
    catchment_id=huc_selector.param.value,
    measure=measure_selector.param.value
)
aggregator = pn.bind(get_aggregator, measure=measure_selector.param.value)
raster_catchments = rasterize(hv.DynamicMap(catchment_polygons), aggregator=aggregator, precompute=True).opts(**opts, colorbar=True)

hover = inspect_polygons(raster_catchments).opts(fill_color='yellow', tools=["hover", 'tap']).opts(alpha=0.5)

stream.source = raster_catchments

layout = pn.Column(
    pn.Row(
        pn.pane.Markdown("# Minimum Example", width=800)
    ),
    pn.Row(
        pn.Column(
            measure_selector,
            huc_selector,
        ),
        pn.Column(
            pn.Row(
                hv.DynamicMap(get_basemap) * raster_catchments * hover
            ),
            pn.Row(
                pn.bind(get_name_pane, x=stream.param.x, y=stream.param.y)
            )
        )
    )
)
layout.servable()
simple_example.ipynb (8.9 MB)
I would also appreciate some general feedback on the overall approach I used. I am having some difficulty understanding the nuance around when to use pn.bind(), @pn.depends(), hv.DynamicMap with streams and creating a class based on param.Parameterized to make it interactive. Any feedback or thoughts on this topic (or links to places it has been discussed) would be awesome.
Thanks,
Matt
