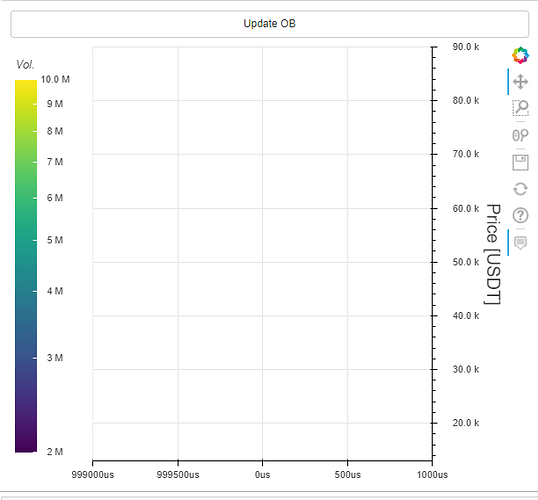
Zoomable Live-Data

Hi,

Is there a way to configure a holoviews streaming plot to keep up with live-data (change x1), but not force x0, or the y-range to change (or only change the y-range if a new min/max is reached)?

I want to be able to zoom around, but I also want the plot to follow live-data.

I’m using Holoviews’ buffer:

buffer2= Buffer(
    data=pd.DataFrame({
        "date":np.array([],dtype=np.datetime64),
        "price":np.array([],dtype=np.float64),}),
    index=False,length=int(1e18),following=True)

dmap2 = hv.DynamicMap(hv.Curve,streams=[buffer2]).apply(resample,rule='5s',function=last).opts(responsive=True,
                                                                    ylabel=f"Price [{quote_currency}]",
                                                                      xlabel="Date (UTC)",yformatter=formatter)

I know that when I set following=False, the range should not update, but I initiate with an empty plot until the data is loaded from disk. So, that’s not ideal either, as the plot then starts at zero and in 1970. It would also require the user to constantly pan the chart.

By the way, the buffer length is intentionally set so high, as I’m dealing with tick-level datetime data here. Meaning, I never have a constant amount of data per time interval.

Dask allows something like this, but I couldn’t figure out how to do it directly in holoviews. The Dask task stream allows you zoom/pan around, detaching from live-range updates, and once you click the reset tool, it goes back to following live data:

1 Like

Listening in. I have the same need. :slight_smile:

1 Like

I have the same need too. It probably needs work at the bokeh level to make the zoom tools configurable to work differently.

3 Likes

I tried to do it directly in Bokeh, but it seems when I zoom in on the y-axis, I loose the following-function.

But it does fix the range-reset on every update.

1 Like

Could you share the code example @Material-Scientist? Thanks.

Sure:

from bokeh.plotting import figure
from bokeh.models import CDSView, ColumnDataSource, IndexFilter, Button, CustomJS, Div, ColorBar, LogColorMapper, HoverTool, FuncTickFormatter
from bokeh.plotting import figure, output_notebook, save, show, output_file
from bokeh.io import curdoc
from bokeh.layouts import gridplot, column, row
from bokeh import events
from bokeh.models.ranges import DataRange1d
from pathlib import Path
import os, glob, warnings, param, tiledb, random, dask, logging, time, json, copy, requests
import panel as pn
import pandas as pd
import numpy as np
from engineering_notation import EngNumber
pn.extension()

warnings.filterwarnings('ignore')

# DB query timestamps
start = pd.datetime.utcnow()-pd.Timedelta('1D')#'2020-11-01'
end = pd.datetime.utcnow()#'2021-01-03'

# Improve DB read performance
config = tiledb.Config({
    "sm.tile_cache_size":str(200_000_000),
    "py.init_buffer_bytes": str(1024**2 * 400)
})

ctx = tiledb.Ctx(config)

# Resolution to read from DB
res = '10min'
# Symbol to load
ticker = 'BTC_USDT'

# Create multi-range subqueries
a = pd.date_range(start=start, end=end, periods=2).to_frame().resample(res).last().index-pd.Timedelta('5min')
b = a+pd.Timedelta('7min') if ticker!= 'BTC_USDT' else a+pd.Timedelta('4min')
c = [slice(*pd.DataFrame({'a':a,'b':b}).iloc[i].values.astype(np.datetime64)) for i in range(len(a))]

# Path to DB
_dir = Path(r'../Material Indicators/mnt/volume-nbg1-1/orderbook_data3/Binance') if ticker!='BTC_USDT' else Path(r'../Material Indicators/mnt/volume-nbg1-1/orderbook_data_BTC_only')
_dir = os.path.join(_dir,ticker)

# Load data from DB and return as multi-index df
with tiledb.open(_dir,ctx=ctx) as A:
    df = A.query(dims=['price','date'],index_col=['price','date']).df[:,c]#.unstack().ffill(axis=1)#.drop_duplicates(subset=['price','date'],keep='last')

def custom_round(x, base=10):
    return (base * round(float(x)/base))

def bin_rows(df,price,freq=50,decimal=0.005):
    k = np.sort(np.concatenate([np.logspace(-8,8,17),np.logspace(-8,8,17)*5]))
    base = k[np.abs(k-np.mean([price.max(),price.min()])*decimal).argmin()]

    bins = pd.interval_range(start=custom_round(price.min()*0.3,base),
                             end=custom_round(price.max()*2,base),
                             freq=base,closed='right')
    return df.groupby(pd.cut(df.index,bins=bins,right=True,include_lowest=True)).sum()

def callback(event):    
    global i
    i+=1
    patch = dict(
            image=[(0,unstacked.iloc[:,:i].values)],
            x=[(0,unstacked.iloc[:,:i].columns.min())],
            y=[(0,unstacked.iloc[:,:i].index.min())],
            dh=[(0,unstacked.iloc[:,:i].index.max()-unstacked.iloc[:,:i].index.min())],
            dw=[(0,unstacked.iloc[:,:i].columns.max()-unstacked.iloc[:,:i].columns.min())]
        )

    source.patch(patch)

# Downsample data in x-axis & y-axis
unstacked = bin_rows(df.unstack().quantity.resample('10min',axis=1).last(),price=pd.Series([45000,43000]))
unstacked.index = [i.right for i in unstacked.index]
unstacked.index.name = 'price'

# Create CDS for bokeh stream, start with first column
i = 1
source = ColumnDataSource(
    dict(
        image=[unstacked.iloc[:,:i].values],
        x=[unstacked.iloc[:,:i].columns.min()],
        y=[unstacked.iloc[:,:i].index.min()],
        dh=[unstacked.iloc[:,:i].index.max()-unstacked.iloc[:,:i].index.min()],
        dw=[unstacked.iloc[:,:i].columns.max()-unstacked.iloc[:,:i].columns.min()]
    )
)

# Load JS code for formatting axes & cmap
with open('JS_code','r') as f:
    JS_Eng_units,JS_decimal = json.load(f).values()
    
formatter = FuncTickFormatter(code=JS_Eng_units)


x_range = DataRange1d(range_padding=0.0)
y_range = DataRange1d(range_padding=0.0)

p = figure(x_range=x_range,y_range=y_range,
           sizing_mode='stretch_width',height=500,
           x_axis_type='datetime',y_axis_location="right")

# Figure out how to change cmap to Fire, as well as how to have a dynamic range
color_mapper = LogColorMapper(palette="Viridis256", low=2e6, high=1e7)

# Image with stream
p.image(
    image='image',x='x',y='y',
    dh='dh',dw='dw',
    source=source,color_mapper=color_mapper
)

# Custom hovertools
p.add_tools(HoverTool(
    tooltips=[
        ( "date",  "$x{%F %T}"            ),
        ( "price", "$y{"+f"0.00"+" a}" ),
        ( "value", "@image{0,0.00}"      ),
    ],

    formatters={
        '$x'      : 'datetime', # use 'datetime' formatter for 'date' field
    },

    # display a tooltip whenever the cursor is vertically in line with a glyph
#     mode='vline'
))

# Formatting stuff
p.yaxis.formatter = formatter
p.yaxis.axis_label_text_font_style = 'normal'
p.yaxis.axis_label = 'Price [USDT]'
# p.yaxis.axis_label_text_font = 'roboto'
p.yaxis.axis_label_text_font_size = '20px'
color_bar = ColorBar(title='Vol.',title_standoff=10,width=25,color_mapper=color_mapper, label_standoff=7,formatter=formatter,location=(0,0))
p.add_layout(color_bar, 'left')

# Add button with callback
button = Button(label="Update OB")
button.on_click(callback)

layout = column(button,p)
# curdoc().add_root(layout)

# Use panel to display
pn.Column(layout)

Sample data (csv):
https://1drv.ms/u/s!ArP7_EkyioIBxuAp7LiIv9Evg9EsOA?e=PdS9KM

1 Like

I’ve just added a line plot on top:

However, I can’t get the following feature to work, based on the line-plot. It only works when the plot is fully zoomed out.

Here is an example of the same code, but with the image plot disabled:

In that case, it does follow the line’s y-range (which is desired).

Additional code:

def get_patch_and_stream(cds,df,index_col='date',multi_index=False):
    """
    Finds indices of df values in cds, and zips them together for creating a patch for cds.patch(),
    as well as find all the new values and return them for updating the cds with cds.stream()
    """
    df = df.copy()
    if not multi_index:
        # Overlapping data
        overlap = pd.Series(cds.data[index_col])[pd.Series(cds.data[index_col]).isin(pd.Series(df.index.values))]
        # Indieces for patching
        cds_idxs = overlap.index
        # Values for patching
        df_values = df.loc[overlap.values]
        # Patch in form of 
        # patch = {
        #     'key1' : [ (idx0,val0), (idx1,val1) ],
        #     'key2' : [ (idx0,val0), (idx1,val1) ],
        # }
        patch = {key:list(zip(cds_idxs.tolist(),df_values.reset_index()[key].to_list())) for key in df.reset_index().columns}
        stream = df[~df.isin(df_values)].dropna(subset=(df.columns))
        return patch,stream
    # Ignore this - it's better to send the full picture every time. Otherwise a custom bokeh renderer is required.
    # Patches multi-index dataframe for sending only updated image data
    else:
        # Overlapping data
        overlap = pd.Series(cds.data['price_date'])[pd.Series(cds.data['price_date']).isin(pd.Series(df.index.values))]
        # Indices for patching
        cds_idxs = overlap.index
        # Values for patching
        df_values = df.loc[overlap.values]
        # Assign multi-index as column
        tmp = df_values.reset_index(drop=True).assign(price_date=df_values.index)
        # Patch
        patch = {key:list(zip(cds_idxs.tolist(),tmp[key].to_list())) for key in tmp.columns}
        # Stream
        stream = df[~df.isin(df_values)].dropna(subset=(df.columns))
        return patch,stream

def callback(event='test'):    
    global i
    i+=1
    patch = dict(
            image=[(0,unstacked.iloc[:,:i].values)],
            x=[(0,unstacked.iloc[:,:i].columns.min())],
            y=[(0,unstacked.iloc[:,:i].index.min())],
            dh=[(0,unstacked.iloc[:,:i].index.max()-unstacked.iloc[:,:i].index.min())],
            dw=[(0,unstacked.iloc[:,:i].columns.max()-unstacked.iloc[:,:i].columns.min())]
        )
    # Update cmap values
    color_mapper.low=unstacked.iloc[:,:i].replace(0,np.nan).quantile(0.70).max()
    color_mapper.high=unstacked.iloc[:,:i].replace(0,np.nan).quantile(0.98).max()
    source.patch(patch)
    
    # update price data
    patch,stream = get_patch_and_stream(source2,df2.iloc[:i],index_col='date',multi_index=False)
    source2.patch(patch)
    source2.stream(stream)
#     pd.DataFrame(source2.data)

# create CDSfor bokeh, start with first row (price data)
source2 = ColumnDataSource(df2.iloc[:i])

# Add price data
p.line(x="date", y="price", source=source2, line_width=3)

Also asked on the Bokeh discourse, and added code for generating fake data:
Am really stuck with this issue…

Alright, I have found a workaround. Bokeh devs probably won’t like it, but it works for now.

Since the renderer has the option to only consider visible glyphs, you can make the heatmap glyph invisible by setting visible=False.

However, you still want to render it. So, you can just change the render function in the boke.min.js file:

from

render(){this.model.visible&&this._render(),this._has_finished=!0}}

to:

render(){this._render(),this._has_finished=!0}}

This will not consider the glyph for the range calculations, but will still render it.
And since I don’t have glyphs I don’t want to render anyway, I don’t care.

But for the changes to take effect, you need to tell bokeh to load the local files, rather than the CDN.

You can do this by typing:

export BOKEH_RESOURCES='inline' (linux)
$Env:BOKEH_RESOURCES="inline" (windows)

before running your application.

Result:

However, as you can see, it breaks the hover tool. This should be able to be changed somewhere too, I guess.

This is only a workaround and bokeh should probably add functionality to only consider certain glyphs for the range-calculations.

1 Like

Here’s also an example of a live-chart with periodic callback.

You can zoom around the chart when you detach from the live-view, and go back to range-following by clicking the reset tool.

Apparently, this does the trick! :slight_smile:

# Add price data
price = p.line(x="date", y="price", source=source2, line_width=3,visible=True)

p.x_range = DataRange1d(range_padding=0.0,follow='end',only_visible=True)
p.y_range = DataRange1d(range_padding=0.5,follow='end',only_visible=True,renderers=[price,])
1 Like

Was the 3 lines all that was needed @Material-Scientist and not all the exploration you did before?

Yep, haha. Wasted a few hours digging through js code trying to change the behavior, but as it turns out you can just supply the renderers you want for the auto-follow.

But it would be great to also have the same behavior in holoviews (live-following when reset is pressed, and otherwise inspectable historical data).

1 Like