Hello people! I was wonder if I can put an image like background into a scatter hvplot? Thank you so much!
code:
ihvplot = ipipeline.hvplot(x=‘x’, y=‘y’, kind=‘scatter’, height=400, by=‘nomClass’ , line_color=‘k’, hover_cols=[‘idBox’, ‘nomClass’])
1 Like
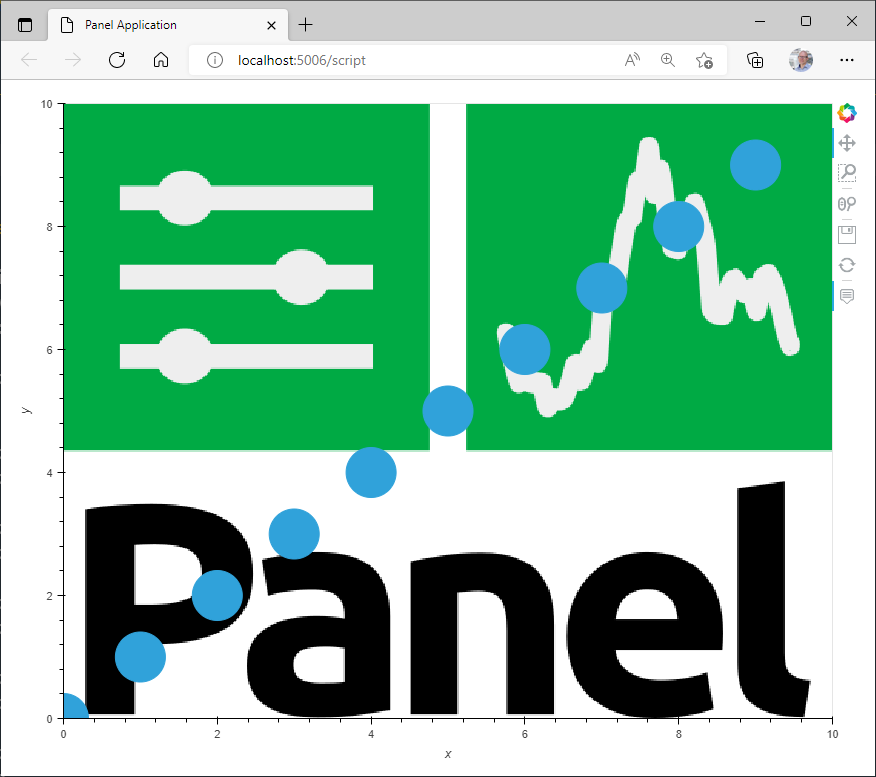
![]() here is the answer!
here is the answer!
1 Like
Here is an example
import holoviews as hv
import hvplot.pandas
import panel as pn
import pandas as pd

from urllib import request
IMAGE_URL = "https://panel.holoviz.org/_static/logo_stacked.png"
FILE = "logo_stacked.png"
response = request.urlretrieve(IMAGE_URL, FILE)

scatter_plot = pd.DataFrame({
  "x": list(range(0,10)), "y": list(range(0,10))
}).hvplot.scatter(x="x", y="y").opts(size=50)

image = hv.RGB.load_image(FILE, bounds=(0,0,10,10))

layout = image*scatter_plot
layout.opts(responsive=True)
pn.panel(layout, sizing_mode="stretch_both").servable()
1 Like
Hi Marc!! Thanks for your early response.
This is my code, I can´t see the points of the scatter plot beacuse the image is in front, can you tell me how can I fix this to see the ponit in front of the image? Thanks!!!
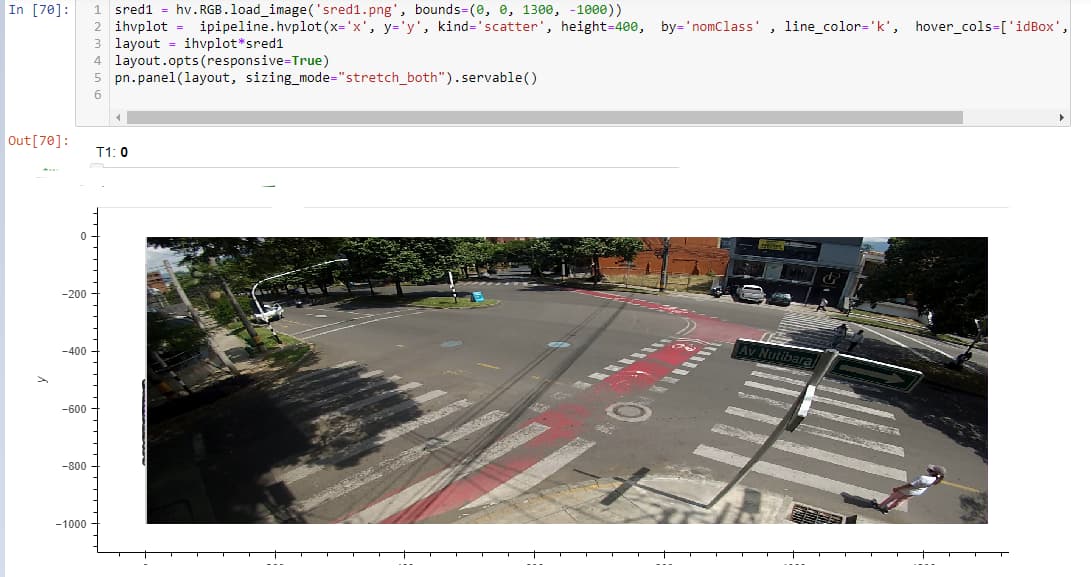
Try to swap the order like this: layout = sred1 * ihvplot
Hi Hoxbro, The order don´t fixed. ![]()
The hvplot, plot and interactive df. I was thinking that the problem is with this sizing mode that is not working:
layout.opts(responsive=True)
pn.panel(layout, sizing_mode=“stretch_both”).servable()
Thanks a lot
Can you share a minimal, reproducible example (MRE) of the problem?
import holoviews as hv
import hvplot.pandas
import panel as pn
import pandas as pd
from urllib import request
IMAGE_URL = “https://panel.holoviz.org/_static/logo_stacked.png”
FILE = “logo_stacked.png”
response = request.urlretrieve(IMAGE_URL, FILE)
cylinders = pn.widgets.IntSlider(name=‘x1’, start=0, end=10, step=1)
df = pd.DataFrame({
“x”: list(range(0,10)), “y”: list(range(0,10))
})
idf = df.interactive()
ipipeline = (
idf[
(idf.x > cylinders)
]
)
scatter_plot = ipipeline.hvplot(x=“x”, y=“y”, kind=‘scatter’)
image = hv.RGB.load_image(FILE, bounds=(0,0,10,10))
layout = image*scatter_plot
layout.opts(responsive=True)
pn.panel(layout, sizing_mode=“stretch_both”).servable()
I think the MRE code you provided should work, so I would consider it a bug within hvplot. Can you file a bug report here?
To get it to work right now, you can do the following:
import holoviews as hv

import hvplot.pandas
import panel as pn
import pandas as pd

from urllib import request

IMAGE_URL = "https://panel.holoviz.org/_static/logo_stacked.png"
FILE = "logo_stacked.png"
response = request.urlretrieve(IMAGE_URL, FILE)
image = hv.RGB.load_image(FILE, bounds=(0,0,10,10))

cylinders = pn.widgets.IntSlider(name="x1", start=0, end=10, step=1)

df = pd.DataFrame({"x": range(0,10), "y": range(0,10)})
idf = df.interactive()
ipipeline = idf[(idf.x > cylinders)]
scatter_plot = ipipeline.hvplot(x="x", y="y", kind="scatter", color="red")

layout = image * scatter_plot.holoviews()
pn.Column(cylinders, layout)