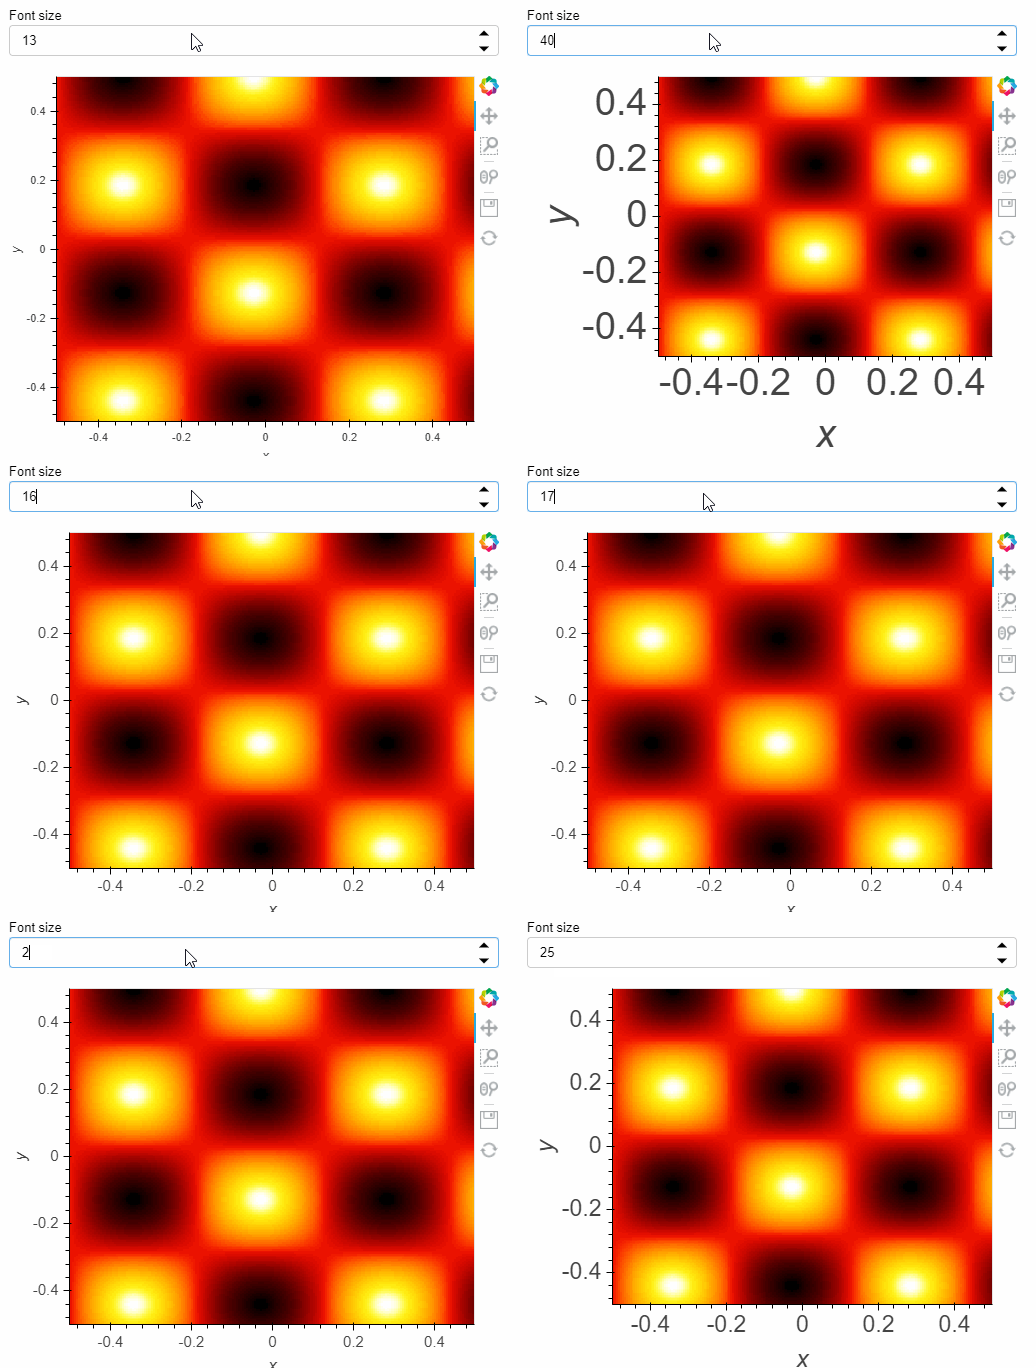
Is there a way to adjust fontsize of labels in plots thru jslink?
Relevant:
Hi, there have been attempts to change the colormap and other attributes of a plot.
The solution in this forum so far has been to create a new plot object with the new cmap.
However, sometimes this is not desired or feasible (large plots or keeping existing zoom level).
So, I pieced together a small example of how jslink can be used to update a heatmap’s colorbar range and colormap via JS, instead of re-creating the plot from scratch every time.
Result:
[ezgif-1-848309a323f2]
Code:
cmaps…
https://panel.holoviz.org/gallery/links/bokeh_property_editor.html#links-gallery-bokeh-property-editor https://panel.holoviz.org/gallery/links/holoviews_glyph_link.html#links-gallery-holoviews-glyph-link
based on the topic you linked you can di this:
cmaps = matplotlib.pyplot.colormaps()
cmap_dict = {}

for cmap in cmaps:
    _cmap = matplotlib.cm.get_cmap(str(cmap), 12)
    cmap_dict[str(cmap)] = [matplotlib.colors.rgb2hex(_cmap(i)[:3]) for i in range(_cmap.N)]

def get_blank_plot():
    #p1 = hv.Curve([],kdims=["Date"],vdims=["Price [BTC]"]).opts(responsive=True)
    ls = np.linspace(0, 10, 200)
    xx, yy = np.meshgrid(ls, ls)

    p1 = hv.Image(np.sin(xx)*np.cos(yy),kdims=['x','y'],vdims=['z'])
    return p1

class Example(param.Parameterized):
    EXAMPLE_PLOT = get_blank_plot().opts(width=500,height=400)

    def __init__(self, **params):
        super().__init__(**params)

        self.plot_pane = pn.pane.HoloViews(self.EXAMPLE_PLOT)
        self.font_size = pn.widgets.IntInput(end=40,start=5,value=13,name='Font size')

        self.font_size.jslink(self.plot_pane, code={'value':'''
            xaxis.major_label_text_font_size = `${cb_obj.value-2}px`
            xaxis.axis_label_text_font_size = `${cb_obj.value}px`
            yaxis.major_label_text_font_size = `${cb_obj.value-2}px`
            yaxis.axis_label_text_font_size = `${cb_obj.value}px`
        '''})

    def panel(self):
        return pn.Column(self.font_size, self.plot_pane)

app = Example(name='')
app.panel()
1 Like
Thanks! This is super useful. Maybe panel can have a util dropdown method for post-tweaking to modify all these settings (colorbar + axis range + fontsize)
Yes I think it is a good idea to produce better plots live for presentation for exemple.
import param


class AxisOptionsPanel(param.Parameterized):
    """
    Class (try) to define all axis options available for Panel
    """

    width = param.Integer(default=800, bounds=(200, 1600))
    height = param.Integer(default=600, bounds=(200, 1600))
    shared_axes = param.Boolean(True, doc="Share axes parameter")
    grid = param.Boolean(default=False, doc="Whether to show a grid")
    legend = param.ObjectSelector(default="top", objects=("top_right", "top_left", "bottom_left", "bottom_right", "right", "left", "top", "bottom", None),
                                  doc="Whether to show a legend, or a legend position")
    rot = param.Integer(default=45, bounds=(0, 180),
                        doc="Rotates the axis ticks along the x-axis by the specified number of degrees.")
    #        xlim        = param.Number(8.2,bounds=(7.5,10))
    #        ylim        = param.Number(8.2,bounds=(7.5,10))
    xticks = param.Integer(default=6, bounds=(1, 10))
    yticks = param.Integer(default=6, bounds=(1, 10))
show original
2 Likes
