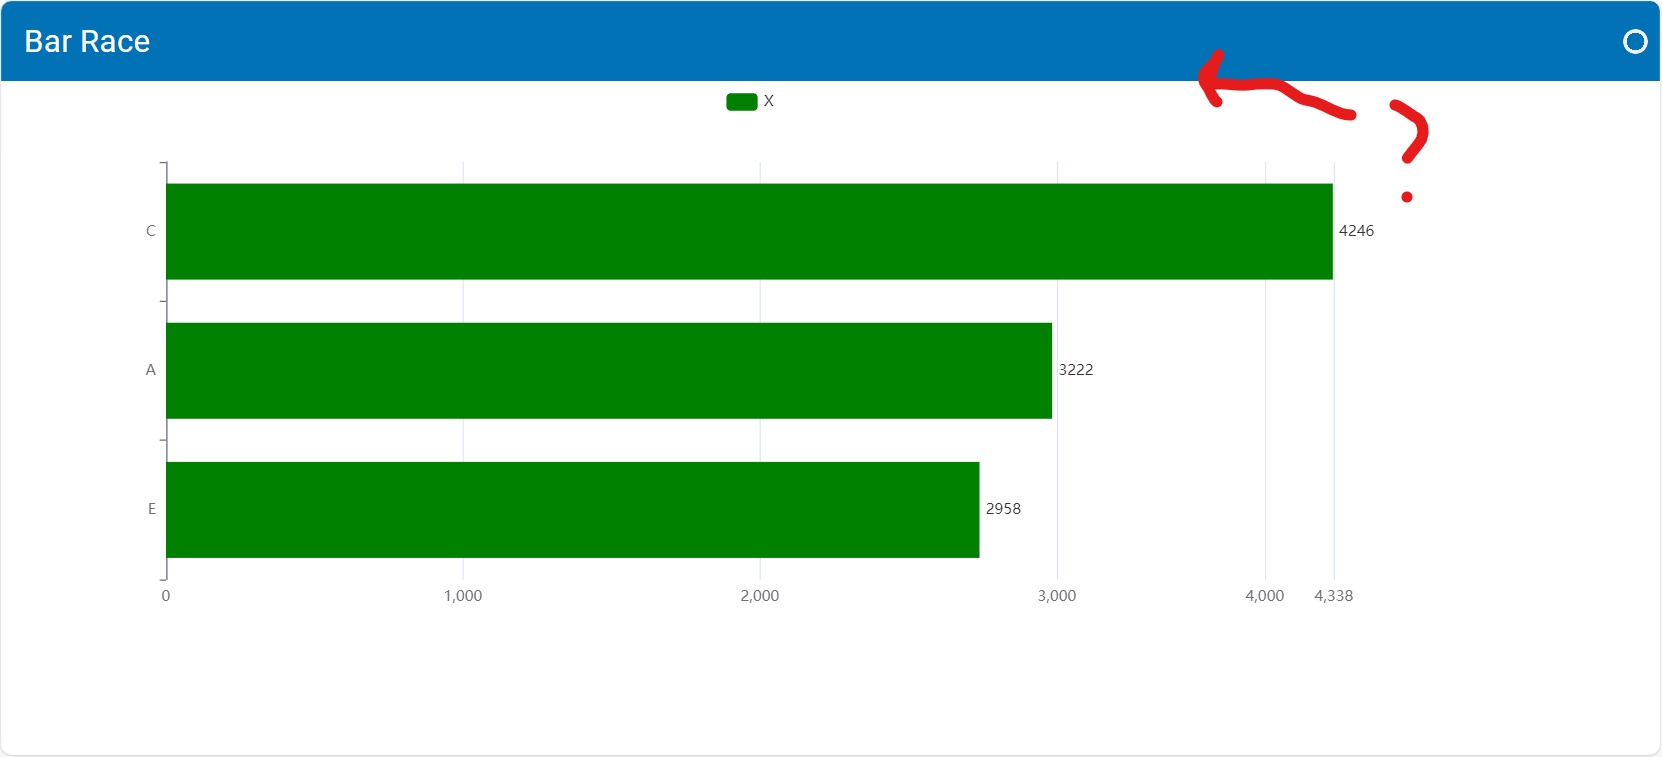
I managed to get Bar Race with pn.pane.HTML()
import panel as pn

pn.extension()
# js_files = {"echarts5": "https://cdn.jsdelivr.net/npm/echarts@5.4.3/dist/echarts.min.js"}
# pn.extension(js_files=js_files)

bar_color = "green"
html = f"""
    <body style="height: 100%; margin: 0">

        <div id="main" style="height: 100%"></div>
        <script type="text/javascript" src="https://code.jquery.com/jquery-3.6.0.min.js"></script> <!-- Include jQuery -->
        <script type="text/javascript">

var option;

const data = [];
for (let i = 0; i < 5; ++i) {{
  data.push(Math.round(Math.random() * 200));
}}
option = {{
  xAxis: {{
    max: 'dataMax'
  }},
  yAxis: {{
    type: 'category',
    data: ['A', 'B', 'C', 'D', 'E'],
    inverse: true,
    animationDuration: 300,
    animationDurationUpdate: 300,
    max: 2 // only the largest 3 bars will be displayed
  }},
  series: [
    {{
      realtimeSort: true,
      name: 'X',
      type: 'bar',
      data: data,
      label: {{
        show: true,
        position: 'right',
        valueAnimation: true
      }},
      itemStyle: {{
        color: '{bar_color}'
      }}
    }}
  ],
  legend: {{
    show: true
  }},
  animationDuration: 0,
  animationDurationUpdate: 3000,
  animationEasing: 'linear',
  animationEasingUpdate: 'linear'
}};
function run() {{
  for (var i = 0; i < data.length; ++i) {{
    if (Math.random() > 0.9) {{
      data[i] += Math.round(Math.random() * 2000);
    }} else {{
      data[i] += Math.round(Math.random() * 200);
    }}
  }}
  myChart.setOption({{
    series: [
      {{
        type: 'bar',
        data
      }}
    ]
  }});
}}

setInterval(function () {{
  run();
}}, 3000);

var chartDom = document.getElementById("main");
var myChart;

function initializeChart() {{
    myChart = echarts.init(chartDom);
    if (option && typeof option === 'object') {{
        myChart.setOption(option);
    }}

    setTimeout(function () {{
    run();
    }}, 0);
}}

var script = document.createElement('script');
script.src = 'https://cdn.jsdelivr.net/npm/echarts@5.4.3/dist/echarts.min.js';  // Specify the ECharts version
script.onload = initializeChart;
document.head.appendChild(script);

        </script>
    </body>
"""

bar_race = pn.pane.HTML(html, width=500, height=500)
tmpl = pn.template.MaterialTemplate(title="Bar Race")
tmpl.main.append(bar_race)
tmpl.servable()
However, when I attempt to incorporate a widget for altering the color of the bar, the widget doesn’t appear visible. It appears that the chart is covering up all other content. This issue might be related to the “id” attribute being set to “main” in the JavaScript script. However, altering the ID name results in an error: “Uncaught TypeError: Cannot read properties of null (reading ‘getAttribute’).”
import panel as pn

pn.extension()
# js_files = {"echarts5": "https://cdn.jsdelivr.net/npm/echarts@5.4.3/dist/echarts.min.js"}
# pn.extension(js_files=js_files)

bar_color = pn.widgets.RadioButtonGroup(
    name="Select Color",
    options=["green", "red", "blue"],
    button_type="success",
    button_style="outline",
    orientation="horizontal",
)


@pn.depends(bar_color.param.value)
def change_bar_color(color):
    html = f"""
        <body style="height: 100%; margin: 0">

            <div id="main" style="height: 100%"></div>
            <script type="text/javascript" src="https://code.jquery.com/jquery-3.6.0.min.js"></script> <!-- Include jQuery -->
            <script type="text/javascript">

    var option;

    const data = [];
    for (let i = 0; i < 5; ++i) {{
    data.push(Math.round(Math.random() * 200));
    }}
    option = {{
    xAxis: {{
        max: 'dataMax'
    }},
    yAxis: {{
        type: 'category',
        data: ['A', 'B', 'C', 'D', 'E'],
        inverse: true,
        animationDuration: 300,
        animationDurationUpdate: 300,
        max: 2 // only the largest 3 bars will be displayed
    }},
    series: [
        {{
        realtimeSort: true,
        name: 'X',
        type: 'bar',
        data: data,
        label: {{
            show: true,
            position: 'right',
            valueAnimation: true
        }},
        itemStyle: {{
            color: '{color}'
        }}
        }}
    ],
    legend: {{
        show: true
    }},
    animationDuration: 0,
    animationDurationUpdate: 3000,
    animationEasing: 'linear',
    animationEasingUpdate: 'linear'
    }};
    function run() {{
    for (var i = 0; i < data.length; ++i) {{
        if (Math.random() > 0.9) {{
        data[i] += Math.round(Math.random() * 2000);
        }} else {{
        data[i] += Math.round(Math.random() * 200);
        }}
    }}
    myChart.setOption({{
        series: [
        {{
            type: 'bar',
            data
        }}
        ]
    }});
    }}

    setInterval(function () {{
    run();
    }}, 3000);

    var chartDom = document.getElementById("main");
    var myChart;

    function initializeChart() {{
        myChart = echarts.init(chartDom);
        if (option && typeof option === 'object') {{
            myChart.setOption(option);
        }}

        setTimeout(function () {{
        run();
        }}, 0);
    }}

    var script = document.createElement('script');
    script.src = 'https://cdn.jsdelivr.net/npm/echarts@5.4.3/dist/echarts.min.js';  // Specify the ECharts version
    script.onload = initializeChart;
    document.head.appendChild(script);

            </script>
        </body>
    """
    return pn.pane.HTML(html, width=500, height=500)


bar_race = pn.bind(change_bar_color, bar_color)

tmpl = pn.template.MaterialTemplate(title="Bar Race")
tmpl.main.append(pn.Row(bar_color, bar_race))
tmpl.servable()