Hello All,
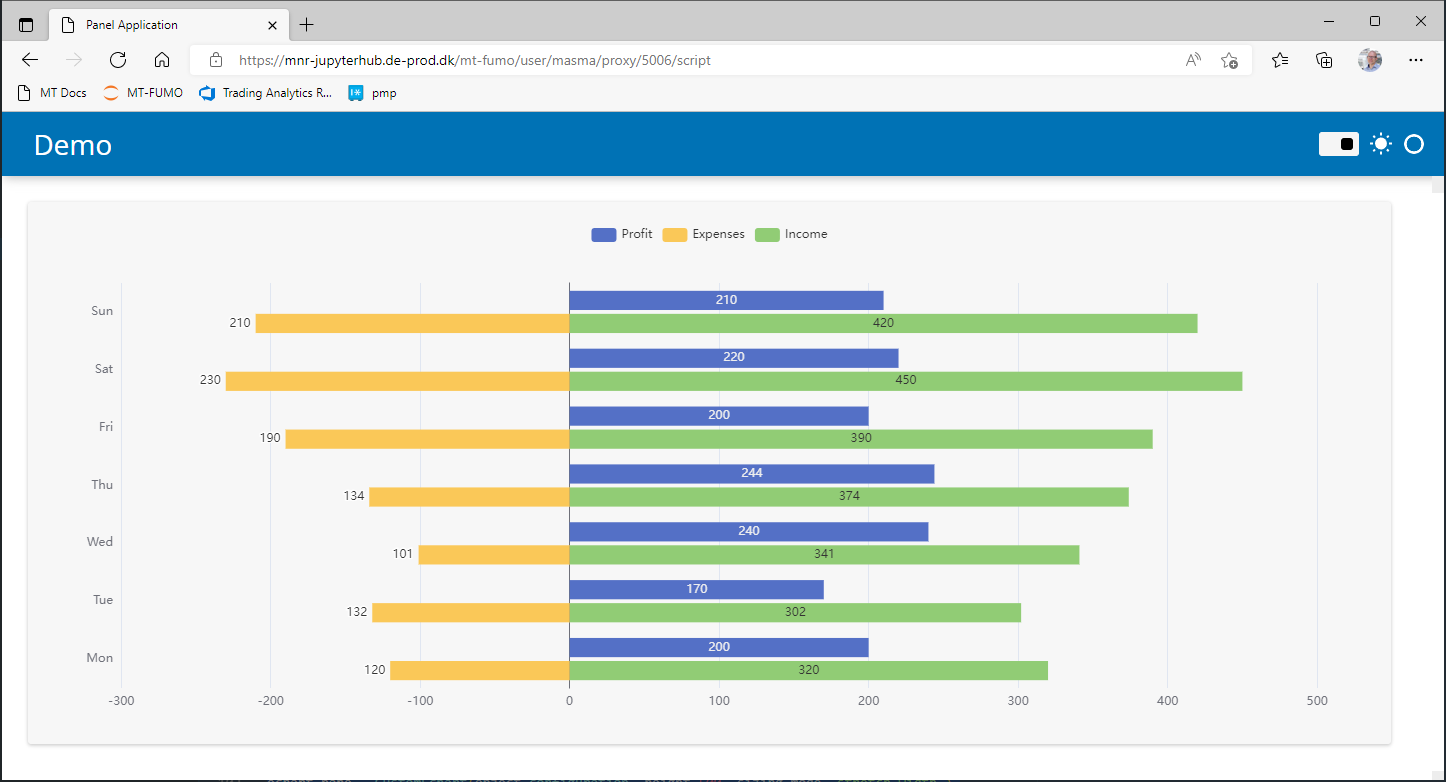
I am trying to make the following EChart within panel: Examples - Apache ECharts
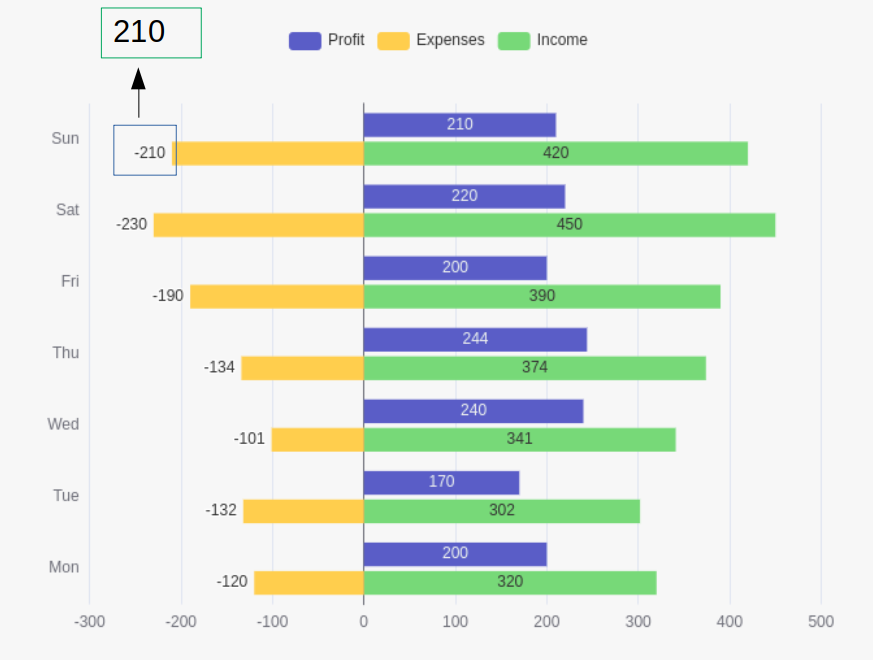
However, I would like to display the negative numbers as positive numbers, without affecting their positioning.
As shown here, “-210” to be listed as “210”.
The code is here:
import panel as pn
pn.extension(sizing_mode="stretch_width")
echart_demo = option = {
'tooltip': {
'trigger': 'axis',
'axisPointer': {
'type': 'shadow'
}
},
'legend': {
'data': ['Profit', 'Expenses', 'Income']
},
'grid': {
'left': '3%',
'right': '4%',
'bottom': '3%',
'containLabel': True
},
'xAxis': [
{
'type': 'value'
}
],
'yAxis': [
{
'type': 'category',
'axisTick': {
'show': False
},
'data': ['Mon', 'Tue', 'Wed', 'Thu', 'Fri', 'Sat', 'Sun']
}
],
'series': [
{
'name': 'Profit',
'type': 'bar',
'label': {
'show': True,
'position': 'inside'
},
'emphasis': {
'focus': 'series'
},
'data': [200, 170, 240, 244, 200, 220, 210]
},
{
'name': 'Income',
'type': 'bar',
'stack': 'Total',
'label': {
'show': True
},
'emphasis': {
'focus': 'series'
},
'data': [320, 302, 341, 374, 390, 450, 420]
},
{
'name': 'Expenses',
'type': 'bar',
'stack': 'Total',
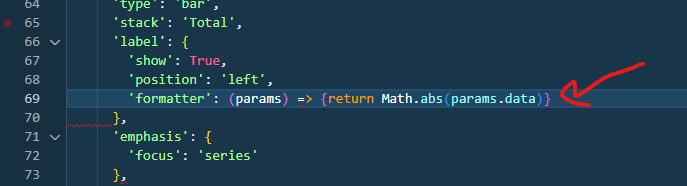
'label': {
'show': True,
'position': 'left'
},
'emphasis': {
'focus': 'series'
},
'data': [-120, -132, -101, -134, -190, -230, -210]
}
]
}
echart_pane = pn.pane.ECharts(echart_demo, height=480, width=640)
template = pn.template.FastListTemplate(
site="Demo",
title="",
main=[pn.Row(echart_pane)]
)
template.servable()
Thank you in advance for any hints!
Br, Sorin