I have been looking at this problem for the last couple of days. Even though I haven’t solved the problem completely, I think I got it to a point where another person can take it over the finish line and todo this, the equation(s) from going from NorthPolarStereo coordinates to lon/lat is needed.
I have changed from hvplot to GeoViews to avoid the following warning and to be able to have dynamic=True.
WARNING:param.main: Calling the .opts method with options broken down by options group (i.e. separate plot, style and norm groups) is deprecated. Use the .options method converting to the simplified format instead or use hv.opts.apply_groups for backward compatibility.
To be able to change the Hovertool a hook is needed.
import cartopy.crs as ccrs
import geoviews as gv
import xarray as xr
from holoviews.operation.datashader import rasterize
from bokeh.models import CustomJSHover
gv.extension("bokeh")
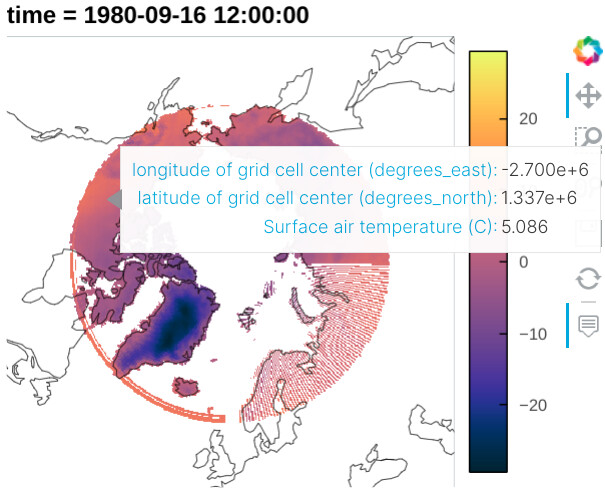
data = xr.tutorial.open_dataset("rasm")["Tair"].isel(time=0)
data = data.where(data["yc"] > 60, drop=True)
# `gv.project` is to fix disappearing rasterize plot when pan zooming
# Opts is to look like hvplot
# Reference: https://github.com/holoviz/geoviews/issues/483
qmeshes = rasterize(gv.project(gv.Dataset(data).to(gv.QuadMesh)))
qmeshes.opts(
projection=ccrs.NorthPolarStereo(),
cmap="coolwarm",
tools=["hover"],
colorbar=True,
symmetric=True,
width=500,
height=400,
)
def conversion_coords_hook(plot, element):
# This is an example of how it could be solved.
# The code for the conversion is just copied/pasted from the example.
# Example: https://github.com/bokeh/bokeh/blob/branch-3.0/examples/plotting/file/customjs_hover.py
code = """
const projections = Bokeh.require("core/util/projections");
const x = special_vars.x
const y = special_vars.y
const coords = projections.wgs84_mercator.invert(x, y)
return coords[%d].toFixed(2)
"""
plot.handles["hover"].tooltips[:2] = [
("wrong lon", "$x{custom}"),
("wrong lat", "$y{custom}"),
]
plot.handles["hover"].formatters = {
"$x": CustomJSHover(code=code % 0),
"$y": CustomJSHover(code=code % 1),
}
qmeshes.opts(hooks=[conversion_coords_hook])
# Adding Coastline
qmeshes * gv.feature.coastline