Can't visualise Points over Image

Hi there,

I’m new to HoloViews, which seems like a great tool for data analysis and visualisation.

I’m working on a piece of code to plot two time-varying geographic datasets on the same figure. My goal is to have a “dynamic” figure where I can use a slider to look at different time steps of the dataset.

The problem is that so far I have not been able to create an overly or layout with both datasets showing up at the same time. I can display two equal copies of either dataset, but not the two different datasets together.

The first dataset (ds_CHL) is a set of images, the second (ds_OLT_patch) are points extracted from another set of images.
To be clear, ds_CHL generates this output:

<bound method Dataset.info of <xarray.Dataset>
Dimensions:  (lat: 240, lon: 360, time: 45)
Coordinates:
  * lat      (lat) float64 24.98 24.94 24.9 24.85 ... 15.15 15.1 15.06 15.02
  * lon      (lon) float64 -29.98 -29.94 -29.9 -29.85 ... -15.1 -15.06 -15.02
  * time     (time) datetime64[ns] 2018-11-25 2018-11-26 ... 2019-01-08
Data variables:
    chlor_a  (time, lat, lon) float32 ...
Attributes: (12/49)
    _NCProperties:                     version=1|netcdflibversion=4.4.1.1|hdf...
    Conventions:                       CF-1.7
    start_date:                        30-DEC-2020 00:00:00.000000
    stop_date:                         30-DEC-2020 23:59:00.000000
    Metadata_Conventions:              Unidata Dataset Discovery v1.0
    cdm_data_type:                     Grid
    ...                                ...
    time_coverage_duration:            P1D
    time_coverage_end:                 202012302359Z
    time_coverage_resolution:          P1D
    time_coverage_start:               202012300000Z
    title:                             Test Images
    tracking_id:                       e8da46e7-cf1c-4530-8aaf-18a3e13272f9>

and ds_OLT_patch.info generates this output:

<bound method Dataset.info of <xarray.Dataset>
Dimensions:  (lat: 4, lon: 4, time: 59)
Coordinates:
  * lon      (lon) float64 -19.88 -19.62 -19.38 -19.12
  * lat      (lat) float64 22.12 22.38 22.62 22.88
  * time     (time) datetime64[ns] 2018-11-11 2018-11-12 ... 2019-01-08
Data variables:
    trajlon  (time, lat, lon) float32 -18.35 -18.47 -18.03 ... -20.29 -19.05
    trajlat  (time, lat, lon) float32 21.62 21.06 21.85 ... 21.91 21.86 22.09>

Here’s my code (there’s more, but for simplicity I’ve only added the part in which I’m using HoloViews):

import numpy as np
import holoviews as hv
from holoviews import opts
import pandas as pd

hv.extension('bokeh')

idate = dt.datetime(2018,12,10)
startdate = idate - dt.timedelta(days=2)
enddate = idate + dt.timedelta(days=2)

# convert ds_OLT_patch to a pandas DataFrame and slice the time to speed things up
trajlat = ds_OLT_patch.sel(time = slice(startdate, enddate)).trajlat.values
trajlon = ds_OLT_patch.sel(time = slice(startdate, enddate)).trajlon.values
time = pd.to_datetime(ds_OLT_patch.sel(time = slice(startdate, enddate)).time.values)

# initialize datetime64 array of the same size as trajlon
tmp = np.Datetime64().astype('M8[ns]')
t64 = np.tile(tmp, [trajlon.shape[0], trajlon.shape[1], trajlon.shape[2]])

# fill datetime64 array with times
for ir in range(4):
    for ic in range(4):
        t64[:,ir,ic] = time
        
# create a pandas dataframe
tt = pd.DataFrame({"lat" : np.ravel(trajlat), 
                   "lon" : np.ravel(trajlon), 
                   "time": np.ravel(t64) 
                  })

# create holoviews object
hv_olt = hv.Dataset(tt)
olt = hv_olt.to(hv.Points, 
                kdims = ["lon", "lat"], 
               ).redim.range(lon = (-25, -16), 
                             lat = ( 18,  24),
                           )           
olt.opts(color = 'r', marker='o', size=5, fill_alpha = 0)

# create holoviews object
hv_chl = hv.Dataset(ds_CHL.sel(time = slice(startdate, enddate)))
chl = hv_chl.to(hv.Image, 
               kdims = ["lon", "lat"], 
               vdims = ["chlor_a"],
               dynamic = False, 
              ).redim.range(lon = (-25, -16), 
                            lat = ( 18,  24),
                            chlor_a = (0.02, 7), 
                           )
chl.opts(colorbar = True, 
              cmap = 'viridis', 
              logz = True,            
    )   

layout = olt + chl
layout.opts( width = 800, 
              height = 300)

And this is the result showing the problem (the top image with layout = olt + chl, the bottom with layout = chl + olt):
Slide1

Ultimately, I’d like to have an overlay in which the red circles appear onto the green-yellow image and I can look at different dates by moving the slide.

What am I doing wrong?

Many thanks in advance for any help you may provide,
grg

Maybe olt * chl or chl * olt instead of layout?

Unless you mean
FAQ — HoloViews 1.14.3 documentation (axiswise)
(olt + chl).opts("Layout", axiswise=True)

Many thanks for your response.

Apologies, I’ve managed to confuse you.
My final objective is to have an “overlay”, but so far I cannot even make it work as a “layout”.

I have these two datasets, that share a dimension.

If I slice them so that they both have only one value of time, I can plot them (and see the results) as a layout (i.e., side by side), but not as an overlay (in that case I only see one of the datasets (the first in the expression, i.e., for chl * olt I will only see chl, and for olt * chl I will only see olt.

However, if I slice multiple time steps from the two datasets (as shown in my previous message) and try to plot them either as layout or overlay, I can only see the first dataset.

I’ve tried the suggestion axiswise=True, but it did not help: I can still only see one of the two datasets only.

Again, any help will be much appreciated.
thanks

It might help if you provided some code that can actually execute:
i.e., have some small data set defined.

Currently, we’d have to read your code closely, and make guesses!

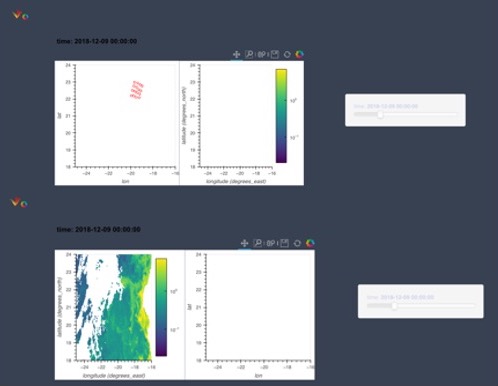
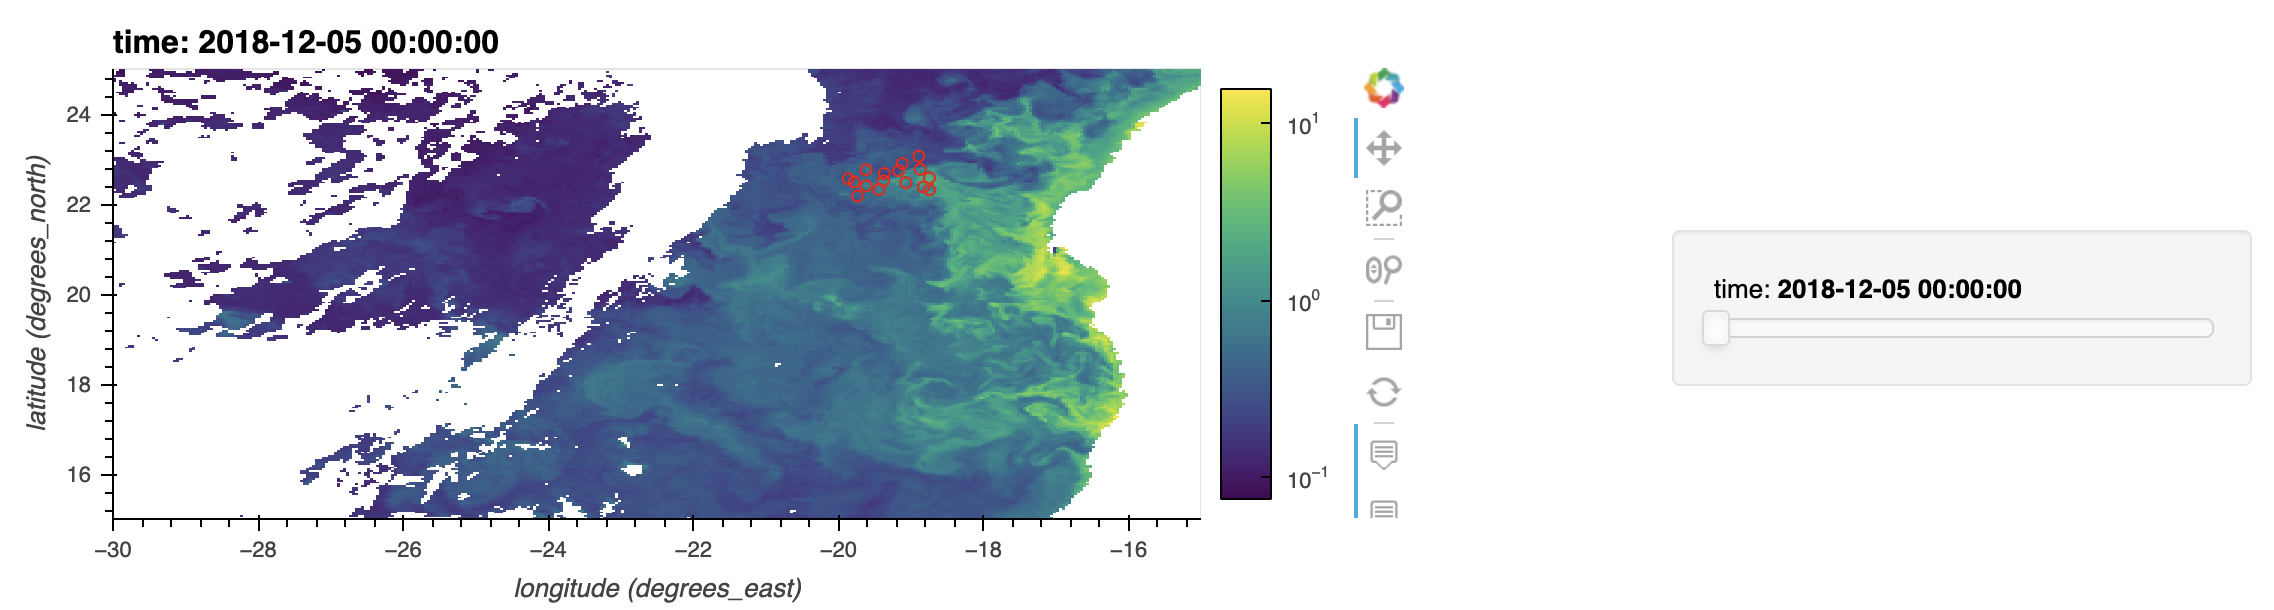
OK, here’s a piece of self-contained code that reproduces the problem (bottom plot in the figure on my original message):

import numpy as np
import holoviews as hv
from holoviews import opts
import pandas as pd
import xarray as xr
import datetime as dt

hv.extension('bokeh')

# temporal parameters
idate = dt.datetime(2018,12,10)
startdate = idate - dt.timedelta(days=5)
enddate = idate + dt.timedelta(days=5)

# spatial parameters
region = {'name':'EBUS_region','lonmin':-30 ,'lonmax':-15, 'latmin':15,'latmax':25}

# Read chl data
# open dataset
GEO_DAILY_THREDDS_string = 'https://rsg.pml.ac.uk/thredds/dodsC/CCI_ALL-v5.0-DAILY'
all_data = xr.open_dataset(GEO_DAILY_THREDDS_string)
# read subsetted data
ds_CHL = all_data['chlor_a'].loc[ { 'time': slice("2018-12-05", "2018-12-15"), 
                                    'lat': slice(region['latmax'], region['latmin']), 
                                    'lon': slice(region['lonmin'], region['lonmax'])}  ]  


# these are the parts of the olt dataset
trajlat = np.asarray([22.56054 , 22.759396, 22.491493, 22.1794  , 22.900251, 22.740063,
       22.6793  , 22.40035 , 22.770443, 22.474922, 22.513588, 22.320257,
       23.06044 , 22.579874, 22.378256, 22.317495, 22.458351, 22.613016,
       22.33959 , 22.10483 , 22.886442, 22.731777, 22.58816 , 22.284351,
       22.856062, 22.582636, 22.450066, 22.276066, 23.077013, 22.715206,
       22.48597 , 22.405874, 22.367208, 22.452827, 22.220829, 22.060638,
       22.803585, 22.673777, 22.488731, 22.229115, 22.903013, 22.676538,
       22.447304, 22.303684, 23.079775, 22.828444, 22.60473 , 22.508064,
       22.28159 , 22.300922, 22.13521 , 22.049591, 22.676538, 22.566065,
       22.411398, 22.231876, 22.869871, 22.712444, 22.491493, 22.358923,
       23.04663 , 22.922346, 22.731777, 22.640635, 22.198734, 22.187685,
       22.107592, 22.085497, 22.510826, 22.458351, 22.372732, 22.295399,
       22.767681, 22.698635, 22.552254, 22.480446, 22.974823, 22.930632,
       22.842253, 22.762157, 22.124163, 22.124163, 22.124163, 22.124163,
       22.375494, 22.375494, 22.375494, 22.375494, 22.624063, 22.624063,
       22.624063, 22.624063, 22.875395, 22.875395, 22.875395, 22.875395,
       22.055115, 22.143496, 22.187685, 22.124163, 22.245686, 22.347876,
       22.477684, 22.483208, 22.510826, 22.530159, 22.615778, 22.715206,
       22.762157, 22.773205, 22.833967, 22.91406 , 22.030258, 22.184923,
       22.245686, 22.126925, 22.171114, 22.364447, 22.58816 , 22.593683,
       22.397589, 22.43073 , 22.596445, 22.792538, 22.651682, 22.657206,
       22.740063, 22.903013, 22.068926, 22.234638, 22.284351, 22.126925,
       22.168352, 22.411398, 22.657206, 22.687586, 22.295399, 22.356161,
       22.54673 , 22.789776, 22.555016, 22.524635, 22.624063, 22.83673 ,
       22.085497, 22.287113, 22.320257, 22.124163, 22.212543, 22.483208,
       22.676538, 22.76492 , 22.218067, 22.323019, 22.488731, 22.7373  ,
       22.461113, 22.422445, 22.508064, 22.740063, 22.077211, 22.32578 ,
       22.356161, 22.115877, 22.248447, 22.549492, 22.657206, 22.784252,
       22.190449, 22.347876, 22.444542, 22.659967, 22.378256, 22.334066,
       22.40035 , 22.637873])

trajlon = np.asarray([-19.862196, -19.619822, -19.77957 , -19.7355  , -19.118547,
       -19.168125, -19.36643 , -19.614313, -18.870665, -19.068972,
       -19.377447, -19.438042, -18.8927  , -18.743969, -18.826597,
       -18.743969, -19.939316, -19.746517, -19.801603, -19.652874,
       -19.355413, -19.327871, -19.471092, -19.548212, -19.024904,
       -19.085497, -19.382957, -19.349905, -19.046938, -18.832106,
       -18.85414 , -18.766005, -19.977875, -19.81262 , -19.763044,
       -19.52067 , -19.581263, -19.4766  , -19.52067 , -19.449059,
       -19.245243, -19.173634, -19.33338 , -19.228718, -19.228718,
       -18.958801, -18.909225, -18.810072, -19.983383, -19.807112,
       -19.674908, -19.388466, -19.752026, -19.59228 , -19.504143,
       -19.327871, -19.498634, -19.311346, -19.29482 , -19.135075,
       -19.438042, -19.1516  , -18.99736 , -18.881683, -19.950333,
       -19.741009, -19.526178, -19.245243, -19.856688, -19.641857,
       -19.449059, -19.206684, -19.718975, -19.4766  , -19.305838,
       -19.091005, -19.658382, -19.377447, -19.1516  , -18.975327,
       -19.848425, -19.600542, -19.377449, -19.1516  , -19.840162,
       -19.592281, -19.380203, -19.154354, -19.842916, -19.597788,
       -19.396729, -19.162617, -19.859444, -19.608805, -19.385712,
       -19.154354, -19.746517, -19.460075, -19.228718, -19.057955,
       -19.823637, -19.542704, -19.311346, -19.102022, -19.966858,
       -19.718975, -19.487617, -19.234226, -20.060503, -19.840162,
       -19.619822, -19.33338 , -19.608805, -19.316854, -19.140583,
       -19.013887, -19.718975, -19.454567, -19.338888, -19.140583,
       -19.9944  , -19.746517, -19.597788, -19.388466, -20.209232,
       -19.999908, -19.823637, -19.564737, -19.438042, -19.212193,
       -19.102022, -18.980835, -19.575754, -19.393974, -19.44355 ,
       -19.228718, -19.966858, -19.707958, -19.691433, -19.59228 ,
       -20.33042 , -20.110079, -19.983383, -19.807112, -19.311346,
       -19.146091, -19.079988, -18.96431 , -19.432533, -19.36643 ,
       -19.581263, -19.360922, -19.895248, -19.647366, -19.746517,
       -19.790586, -20.396523, -20.14864 , -20.077028, -20.010927,
       -19.212193, -19.113039, -19.068972, -18.947784, -19.33338 ,
       -19.399483, -19.724483, -19.531687, -19.790586, -19.559229,
       -19.763044, -19.955841, -20.40754 , -20.132114, -20.10457 ,
       -20.176182])

t64 = np.asarray(['2018-12-05T00:00:00.000000000', '2018-12-05T00:00:00.000000000',
       '2018-12-05T00:00:00.000000000', '2018-12-05T00:00:00.000000000',
       '2018-12-05T00:00:00.000000000', '2018-12-05T00:00:00.000000000',
       '2018-12-05T00:00:00.000000000', '2018-12-05T00:00:00.000000000',
       '2018-12-05T00:00:00.000000000', '2018-12-05T00:00:00.000000000',
       '2018-12-05T00:00:00.000000000', '2018-12-05T00:00:00.000000000',
       '2018-12-05T00:00:00.000000000', '2018-12-05T00:00:00.000000000',
       '2018-12-05T00:00:00.000000000', '2018-12-05T00:00:00.000000000',
       '2018-12-06T00:00:00.000000000', '2018-12-06T00:00:00.000000000',
       '2018-12-06T00:00:00.000000000', '2018-12-06T00:00:00.000000000',
       '2018-12-06T00:00:00.000000000', '2018-12-06T00:00:00.000000000',
       '2018-12-06T00:00:00.000000000', '2018-12-06T00:00:00.000000000',
       '2018-12-06T00:00:00.000000000', '2018-12-06T00:00:00.000000000',
       '2018-12-06T00:00:00.000000000', '2018-12-06T00:00:00.000000000',
       '2018-12-06T00:00:00.000000000', '2018-12-06T00:00:00.000000000',
       '2018-12-06T00:00:00.000000000', '2018-12-06T00:00:00.000000000',
       '2018-12-07T00:00:00.000000000', '2018-12-07T00:00:00.000000000',
       '2018-12-07T00:00:00.000000000', '2018-12-07T00:00:00.000000000',
       '2018-12-07T00:00:00.000000000', '2018-12-07T00:00:00.000000000',
       '2018-12-07T00:00:00.000000000', '2018-12-07T00:00:00.000000000',
       '2018-12-07T00:00:00.000000000', '2018-12-07T00:00:00.000000000',
       '2018-12-07T00:00:00.000000000', '2018-12-07T00:00:00.000000000',
       '2018-12-07T00:00:00.000000000', '2018-12-07T00:00:00.000000000',
       '2018-12-07T00:00:00.000000000', '2018-12-07T00:00:00.000000000',
       '2018-12-08T00:00:00.000000000', '2018-12-08T00:00:00.000000000',
       '2018-12-08T00:00:00.000000000', '2018-12-08T00:00:00.000000000',
       '2018-12-08T00:00:00.000000000', '2018-12-08T00:00:00.000000000',
       '2018-12-08T00:00:00.000000000', '2018-12-08T00:00:00.000000000',
       '2018-12-08T00:00:00.000000000', '2018-12-08T00:00:00.000000000',
       '2018-12-08T00:00:00.000000000', '2018-12-08T00:00:00.000000000',
       '2018-12-08T00:00:00.000000000', '2018-12-08T00:00:00.000000000',
       '2018-12-08T00:00:00.000000000', '2018-12-08T00:00:00.000000000',
       '2018-12-09T00:00:00.000000000', '2018-12-09T00:00:00.000000000',
       '2018-12-09T00:00:00.000000000', '2018-12-09T00:00:00.000000000',
       '2018-12-09T00:00:00.000000000', '2018-12-09T00:00:00.000000000',
       '2018-12-09T00:00:00.000000000', '2018-12-09T00:00:00.000000000',
       '2018-12-09T00:00:00.000000000', '2018-12-09T00:00:00.000000000',
       '2018-12-09T00:00:00.000000000', '2018-12-09T00:00:00.000000000',
       '2018-12-09T00:00:00.000000000', '2018-12-09T00:00:00.000000000',
       '2018-12-09T00:00:00.000000000', '2018-12-09T00:00:00.000000000',
       '2018-12-10T00:00:00.000000000', '2018-12-10T00:00:00.000000000',
       '2018-12-10T00:00:00.000000000', '2018-12-10T00:00:00.000000000',
       '2018-12-10T00:00:00.000000000', '2018-12-10T00:00:00.000000000',
       '2018-12-10T00:00:00.000000000', '2018-12-10T00:00:00.000000000',
       '2018-12-10T00:00:00.000000000', '2018-12-10T00:00:00.000000000',
       '2018-12-10T00:00:00.000000000', '2018-12-10T00:00:00.000000000',
       '2018-12-10T00:00:00.000000000', '2018-12-10T00:00:00.000000000',
       '2018-12-10T00:00:00.000000000', '2018-12-10T00:00:00.000000000',
       '2018-12-11T00:00:00.000000000', '2018-12-11T00:00:00.000000000',
       '2018-12-11T00:00:00.000000000', '2018-12-11T00:00:00.000000000',
       '2018-12-11T00:00:00.000000000', '2018-12-11T00:00:00.000000000',
       '2018-12-11T00:00:00.000000000', '2018-12-11T00:00:00.000000000',
       '2018-12-11T00:00:00.000000000', '2018-12-11T00:00:00.000000000',
       '2018-12-11T00:00:00.000000000', '2018-12-11T00:00:00.000000000',
       '2018-12-11T00:00:00.000000000', '2018-12-11T00:00:00.000000000',
       '2018-12-11T00:00:00.000000000', '2018-12-11T00:00:00.000000000',
       '2018-12-12T00:00:00.000000000', '2018-12-12T00:00:00.000000000',
       '2018-12-12T00:00:00.000000000', '2018-12-12T00:00:00.000000000',
       '2018-12-12T00:00:00.000000000', '2018-12-12T00:00:00.000000000',
       '2018-12-12T00:00:00.000000000', '2018-12-12T00:00:00.000000000',
       '2018-12-12T00:00:00.000000000', '2018-12-12T00:00:00.000000000',
       '2018-12-12T00:00:00.000000000', '2018-12-12T00:00:00.000000000',
       '2018-12-12T00:00:00.000000000', '2018-12-12T00:00:00.000000000',
       '2018-12-12T00:00:00.000000000', '2018-12-12T00:00:00.000000000',
       '2018-12-13T00:00:00.000000000', '2018-12-13T00:00:00.000000000',
       '2018-12-13T00:00:00.000000000', '2018-12-13T00:00:00.000000000',
       '2018-12-13T00:00:00.000000000', '2018-12-13T00:00:00.000000000',
       '2018-12-13T00:00:00.000000000', '2018-12-13T00:00:00.000000000',
       '2018-12-13T00:00:00.000000000', '2018-12-13T00:00:00.000000000',
       '2018-12-13T00:00:00.000000000', '2018-12-13T00:00:00.000000000',
       '2018-12-13T00:00:00.000000000', '2018-12-13T00:00:00.000000000',
       '2018-12-13T00:00:00.000000000', '2018-12-13T00:00:00.000000000',
       '2018-12-14T00:00:00.000000000', '2018-12-14T00:00:00.000000000',
       '2018-12-14T00:00:00.000000000', '2018-12-14T00:00:00.000000000',
       '2018-12-14T00:00:00.000000000', '2018-12-14T00:00:00.000000000',
       '2018-12-14T00:00:00.000000000', '2018-12-14T00:00:00.000000000',
       '2018-12-14T00:00:00.000000000', '2018-12-14T00:00:00.000000000',
       '2018-12-14T00:00:00.000000000', '2018-12-14T00:00:00.000000000',
       '2018-12-14T00:00:00.000000000', '2018-12-14T00:00:00.000000000',
       '2018-12-14T00:00:00.000000000', '2018-12-14T00:00:00.000000000',
       '2018-12-15T00:00:00.000000000', '2018-12-15T00:00:00.000000000',
       '2018-12-15T00:00:00.000000000', '2018-12-15T00:00:00.000000000',
       '2018-12-15T00:00:00.000000000', '2018-12-15T00:00:00.000000000',
       '2018-12-15T00:00:00.000000000', '2018-12-15T00:00:00.000000000',
       '2018-12-15T00:00:00.000000000', '2018-12-15T00:00:00.000000000',
       '2018-12-15T00:00:00.000000000', '2018-12-15T00:00:00.000000000',
       '2018-12-15T00:00:00.000000000', '2018-12-15T00:00:00.000000000',
       '2018-12-15T00:00:00.000000000', '2018-12-15T00:00:00.000000000'],
      dtype='datetime64[ns]')

# combine the parts into a pandas dataframe
tt = pd.DataFrame({"lat" : np.ravel(trajlat), 
                   "lon" : np.ravel(trajlon), 
                   "time": np.ravel(t64) 
                  })


# create holoviews object for olt
hv_olt = hv.Dataset(tt)
olt = hv_olt.to(hv.Points, 
                kdims = ["lon", "lat"], 
               ).redim.range(lon = (-25, -16), 
                             lat = ( 18,  24),
                           )           
olt.opts(color = 'r', marker='o', size=5, fill_alpha = 0)

# create holoviews object for chl
hv_chl = hv.Dataset(ds_CHL.sel(time = slice(startdate, enddate)))
chl = hv_chl.to(hv.Image, 
               kdims = ["lon", "lat"], 
               vdims = ["chlor_a"],
               dynamic = False, 
              ).redim.range(lon = (-25, -16), 
                            lat = ( 18,  24),
                            chlor_a = (0.02, 7), 
                           )
chl.opts(colorbar = True, 
              cmap = 'viridis', 
              logz = True,            
    )   

overlay = chl + olt
overlay.opts( width = 800, 
              height = 300)

unfortunately, this errors out with

UnicodeDecodeError: 'ascii' codec can't decode byte 0x8b in position 1: ordinal not in range(128)

It works for me: I’ve just copied the code above, pasted it into a Jupyter Notebook cell and ran it.

For info, this is the conda environment (conda env export) I am using:

channels:
  - conda-forge
  - defaults
dependencies:
  - _libgcc_mutex=0.1=conda_forge
  - _openmp_mutex=4.5=1_gnu
  - alsa-lib=1.2.3=h516909a_0
  - anyio=2.2.0=py38h578d9bd_0
  - argon2-cffi=20.1.0=py38h497a2fe_2
  - async_generator=1.10=py_0
  - attrs=21.2.0=pyhd8ed1ab_0
  - babel=2.9.1=pyh44b312d_0
  - backcall=0.2.0=pyh9f0ad1d_0
  - backports=1.0=py_2
  - backports.functools_lru_cache=1.6.4=pyhd8ed1ab_0
  - bleach=3.3.0=pyh44b312d_0
  - bokeh=2.3.1=py38h578d9bd_0
  - brotlipy=0.7.0=py38h497a2fe_1001
  - bzip2=1.0.8=h7f98852_4
  - c-ares=1.17.1=h7f98852_1
  - ca-certificates=2020.12.5=ha878542_0
  - cartopy=0.19.0.post1=py38hc9c980b_0
  - certifi=2020.12.5=py38h578d9bd_1
  - cffi=1.14.5=py38ha65f79e_0
  - cftime=1.4.1=py38h5c078b8_0
  - chardet=4.0.0=py38h578d9bd_1
  - colorcet=2.0.6=pyhd8ed1ab_0
  - cryptography=3.4.7=py38ha5dfef3_0
  - curl=7.76.1=h979ede3_1
  - cycler=0.10.0=py_2
  - dbus=1.13.6=h48d8840_2
  - decorator=5.0.7=pyhd8ed1ab_0
  - defusedxml=0.7.1=pyhd8ed1ab_0
  - deprecation=2.1.0=pyh9f0ad1d_0
  - entrypoints=0.3=pyhd8ed1ab_1003
  - expat=2.3.0=h9c3ff4c_0
  - fontconfig=2.13.1=hba837de_1005
  - freetype=2.10.4=h0708190_1
  - geos=3.9.1=h9c3ff4c_2
  - gettext=0.19.8.1=h0b5b191_1005
  - glib=2.68.1=h9c3ff4c_0
  - glib-tools=2.68.1=h9c3ff4c_0
  - gst-plugins-base=1.18.4=hf529b03_2
  - gstreamer=1.18.4=h76c114f_2
  - hdf4=4.2.13=h10796ff_1005
  - hdf5=1.10.6=nompi_h6a2412b_1114
  - holoviews=1.14.3=pyhd8ed1ab_0
  - icu=68.1=h58526e2_0
  - idna=2.10=pyh9f0ad1d_0
  - importlib-metadata=4.0.1=py38h578d9bd_0
  - ipykernel=5.5.4=py38hd0cf306_0
  - ipython=7.23.1=py38hd0cf306_0
  - ipython_genutils=0.2.0=py_1
  - ipywidgets=7.6.3=pyhd3deb0d_0
  - jedi=0.18.0=py38h578d9bd_2
  - jinja2=2.11.3=pyh44b312d_0
  - jpeg=9d=h36c2ea0_0
  - json5=0.9.5=pyh9f0ad1d_0
  - jsonschema=3.2.0=pyhd8ed1ab_3
  - jupyter-packaging=0.10.1=pyhd8ed1ab_0
  - jupyter_client=6.1.12=pyhd8ed1ab_0
  - jupyter_core=4.7.1=py38h578d9bd_0
  - jupyter_server=1.6.4=py38h578d9bd_0
  - jupyterlab=3.0.14=pyhd8ed1ab_0
  - jupyterlab_pygments=0.1.2=pyh9f0ad1d_0
  - jupyterlab_server=2.5.1=pyhd8ed1ab_0
  - jupyterlab_widgets=1.0.0=pyhd8ed1ab_1
  - kiwisolver=1.3.1=py38h1fd1430_1
  - krb5=1.17.2=h926e7f8_0
  - lcms2=2.12=hddcbb42_0
  - ld_impl_linux-64=2.35.1=hea4e1c9_2
  - libblas=3.9.0=9_openblas
  - libcblas=3.9.0=9_openblas
  - libclang=11.1.0=default_ha53f305_1
  - libcurl=7.76.1=hc4aaa36_1
  - libedit=3.1.20191231=he28a2e2_2
  - libev=4.33=h516909a_1
  - libevent=2.1.10=hcdb4288_3
  - libffi=3.3=h58526e2_2
  - libgcc-ng=9.3.0=h2828fa1_19
  - libgfortran-ng=9.3.0=hff62375_19
  - libgfortran5=9.3.0=hff62375_19
  - libglib=2.68.1=h3e27bee_0
  - libgomp=9.3.0=h2828fa1_19
  - libiconv=1.16=h516909a_0
  - liblapack=3.9.0=9_openblas
  - libllvm11=11.1.0=hf817b99_2
  - libnetcdf=4.8.0=nompi_hfa85936_101
  - libnghttp2=1.43.0=h812cca2_0
  - libogg=1.3.4=h7f98852_1
  - libopenblas=0.3.15=pthreads_h8fe5266_0
  - libopus=1.3.1=h7f98852_1
  - libpng=1.6.37=h21135ba_2
  - libpq=13.2=hfd2b0eb_2
  - libsodium=1.0.18=h36c2ea0_1
  - libssh2=1.9.0=ha56f1ee_6
  - libstdcxx-ng=9.3.0=h6de172a_19
  - libtiff=4.2.0=hdc55705_1
  - libuuid=2.32.1=h7f98852_1000
  - libvorbis=1.3.7=h9c3ff4c_0
  - libwebp-base=1.2.0=h7f98852_2
  - libxcb=1.13=h7f98852_1003
  - libxkbcommon=1.0.3=he3ba5ed_0
  - libxml2=2.9.10=h72842e0_4
  - libzip=1.7.3=h4de3113_0
  - lz4-c=1.9.3=h9c3ff4c_0
  - markdown=3.3.4=pyhd8ed1ab_0
  - markupsafe=1.1.1=py38h497a2fe_3
  - matplotlib=3.4.1=py38h578d9bd_0
  - matplotlib-base=3.4.1=py38hcc49a3a_0
  - matplotlib-inline=0.1.2=pyhd8ed1ab_2
  - mistune=0.8.4=py38h497a2fe_1003
  - mysql-common=8.0.23=ha770c72_1
  - mysql-libs=8.0.23=h935591d_1
  - nbclassic=0.2.7=pyhd8ed1ab_0
  - nbclient=0.5.3=pyhd8ed1ab_0
  - nbconvert=6.0.7=py38h578d9bd_3
  - nbformat=5.1.3=pyhd8ed1ab_0
  - ncurses=6.2=h58526e2_4
  - nest-asyncio=1.5.1=pyhd8ed1ab_0
  - netcdf4=1.5.6=nompi_py38h5e9db54_103
  - notebook=6.3.0=pyha770c72_1
  - nspr=4.30=h9c3ff4c_0
  - nss=3.64=hb5efdd6_0
  - numpy=1.20.2=py38h9894fe3_0
  - olefile=0.46=pyh9f0ad1d_1
  - openjpeg=2.4.0=hf7af979_0
  - openssl=1.1.1k=h7f98852_0
  - packaging=20.9=pyh44b312d_0
  - pandas=1.2.4=py38h1abd341_0
  - pandoc=2.12=h7f98852_0
  - pandocfilters=1.4.2=py_1
  - panel=0.11.3=pyhd8ed1ab_0
  - param=1.10.1=pyhd3deb0d_0
  - parso=0.8.2=pyhd8ed1ab_0
  - pcre=8.44=he1b5a44_0
  - pexpect=4.8.0=pyh9f0ad1d_2
  - pickleshare=0.7.5=py_1003
  - pillow=8.1.2=py38ha0e1e83_1
  - pip=21.1.1=pyhd8ed1ab_0
  - proj=7.2.0=h277dcde_2
  - prometheus_client=0.10.1=pyhd8ed1ab_0
  - prompt-toolkit=3.0.18=pyha770c72_0
  - pthread-stubs=0.4=h36c2ea0_1001
  - ptyprocess=0.7.0=pyhd3deb0d_0
  - pycparser=2.20=pyh9f0ad1d_2
  - pyct=0.4.6=py_0
  - pyct-core=0.4.6=py_0
  - pygments=2.9.0=pyhd8ed1ab_0
  - pyopenssl=20.0.1=pyhd8ed1ab_0
  - pyparsing=2.4.7=pyh9f0ad1d_0
  - pyqt=5.12.3=py38h578d9bd_7
  - pyqt-impl=5.12.3=py38h7400c14_7
  - pyqt5-sip=4.19.18=py38h709712a_7
  - pyqtchart=5.12=py38h7400c14_7
  - pyqtwebengine=5.12.1=py38h7400c14_7
  - pyrsistent=0.17.3=py38h497a2fe_2
  - pyshp=2.1.3=pyh44b312d_0
  - pysocks=1.7.1=py38h578d9bd_3
  - python=3.8.8=hffdb5ce_0_cpython
  - python-dateutil=2.8.1=py_0
  - python_abi=3.8=1_cp38
  - pytz=2021.1=pyhd8ed1ab_0
  - pyviz_comms=2.0.1=pyhd3deb0d_0
  - pyyaml=5.4.1=py38h497a2fe_0
  - pyzmq=22.0.3=py38h2035c66_1
  - qt=5.12.9=hda022c4_4
  - readline=8.1=h46c0cb4_0
  - requests=2.25.1=pyhd3deb0d_0
  - scipy=1.6.3=py38h7b17777_0
  - send2trash=1.5.0=py_0
  - setuptools=49.6.0=py38h578d9bd_3
  - shapely=1.7.1=py38h4fc1155_4
  - six=1.16.0=pyh6c4a22f_0
  - sniffio=1.2.0=py38h578d9bd_1
  - sqlite=3.35.5=h74cdb3f_0
  - terminado=0.9.4=py38h578d9bd_0
  - testpath=0.4.4=py_0
  - tk=8.6.10=h21135ba_1
  - tomlkit=0.7.0=py38h578d9bd_3
  - tornado=6.1=py38h497a2fe_1
  - tqdm=4.60.0=pyhd8ed1ab_0
  - traitlets=5.0.5=py_0
  - typing_extensions=3.7.4.3=py_0
  - urllib3=1.26.4=pyhd8ed1ab_0
  - wcwidth=0.2.5=pyh9f0ad1d_2
  - webencodings=0.5.1=py_1
  - wheel=0.36.2=pyhd3deb0d_0
  - widgetsnbextension=3.5.1=py38h578d9bd_4
  - xarray=0.17.0=pyhd8ed1ab_0
  - xorg-libxau=1.0.9=h7f98852_0
  - xorg-libxdmcp=1.1.3=h7f98852_0
  - xz=5.2.5=h516909a_1
  - yaml=0.2.5=h516909a_0
  - zeromq=4.3.4=h9c3ff4c_0
  - zipp=3.4.1=pyhd8ed1ab_0
  - zlib=1.2.11=h516909a_1010
  - zstd=1.4.9=ha95c52a_0

Does this help?

Hi,

I’m trying to figure out where your error comes from and I’ve come across this page: https://stackoverflow.com/questions/9644099/python-ascii-codec-cant-decode-byte

They suggest checking what the “default encoding” for your shell is using this command: locale charmap. If this does not return UTF-8, then you need to set the default encoding using export LC_CTYPE="en_EN.UTF-8" (and then verify that the output of locale charmap has changed to UTF-8.

Alternatively, they suggest adding this just after the imports:

import sys
reload(sys)
sys.setdefaultencoding("utf-8")

or yet another alternative is:

# -*- coding: utf-8 -*- 

I hope this helps.

Honestly not quite sure what’s up with your version but using hvPlot makes this all a lot easier to construct:


import hvplot.pandas
import hvplot.xarray

ds_CHL.sel(time =slice(startdate, enddate)).hvplot(groupby='time', colorbar=True, cnorm='log', cmap='viridis') *\
tt.hvplot.points('lon', 'lat', groupby='time', line_color='red', fill_alpha=0)

This works for me as well: many thanks indeed!

Is there a way to set the default time step to visualise initially?
e.g., I’d like the visualisation to start on 2018-12-10

many thanks this is brilliant!
grg

Should expose this in hvPlot directly somehow but you can use .redim.default to set a default time value:

raster = ds_CHL.sel(time =slice(startdate, enddate)).hvplot(groupby='time', colorbar=True, cnorm='log', cmap='viridis')
points = tt.hvplot.points('lon', 'lat', groupby='time', line_color='red', fill_alpha=0)

(raster * points).redim.default(time=np.datetime64('2018-12-12T00:00:00'))

awesome, thanks a lot!!