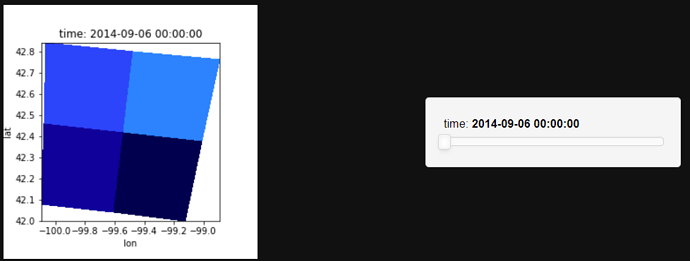
I am trying to overaly hv.points on top of hv.quadmesh or hv.image where both these plots have a time dimension.
Similar to this problem but i dont want to use hvplot. Can't visualise Points over Image
import xarray as xr
import numpy as np
import pandas as pd
import holoviews as hv
hv.extension(‘bokeh’)#create data
np.random.seed(0)
temperature = 15 + 8 * np.random.randn(2, 2, 3)
precipitation = 10 * np.random.rand(2, 2, 3)
lon = [[-99.83, -99.32], [-99.79, -99.23]]
lat = [[42.25, 42.21], [42.63, 42.59]]
time = pd.date_range(“2014-09-06”, periods=3)
reference_time = pd.Timestamp(“2014-09-05”)ds = xr.Dataset(
data_vars=dict(
temperature=([“x”, “y”, “time”], temperature),
precipitation=([“x”, “y”, “time”], precipitation),
),
coords=dict(
lon=([“x”, “y”], lon),
lat=([“x”, “y”], lat),
time=time,
reference_time=reference_time,
),
attrs=dict(description=“Weather related data.”),
)
df = ds.temperature.to_dataframe().reset_index()
#create quadmesh plot
img = hv.Dataset(ds, [‘lon’, ‘lat’,‘time’],[‘temperature’]).to(hv.QuadMesh,[‘lon’, ‘lat’],[‘temperature’])
img
#create points plot
pnt = hv.Points(df,vdims=[‘temperature’,‘time’], kdims=[‘lon’,‘lat’]).groupby(‘time’).opts(color=‘temperature’,cmap=‘turbo’)
pnt
Both above plots work. But when overlay of both image and point plots only the first plot shows up
img*pnt
If i remove the time component from the points plot i can overlay the data but then the slider does not change points values with time
img*hv.Points(df,vdims=[‘temperature’,‘time’], kdims=[‘lon’,‘lat’]).opts(color=‘temperature’,cmap=‘turbo’)
Thank you for your help !!
