Dear all,
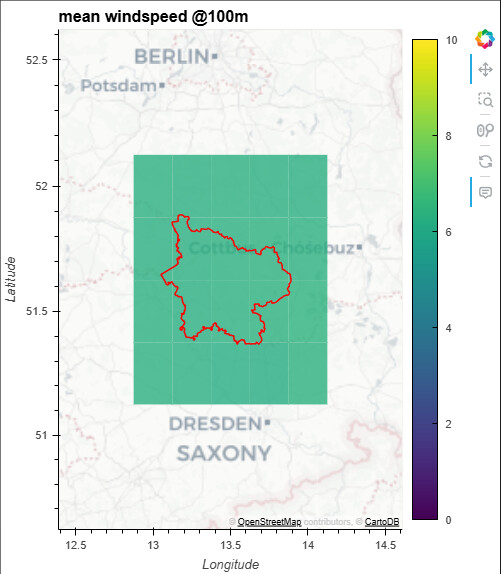
I am plotting windspeed data from a netCDF file on a map. It shows the mean windspeed.
Is there also a way to click on one cell and then the timeseries itself is automatically plotted below?
Dear all,
I am plotting windspeed data from a netCDF file on a map. It shows the mean windspeed.
Is there also a way to click on one cell and then the timeseries itself is automatically plotted below?
See something like this or