Hi @szy , welcome to the holoviz discourse. For a next time, you have better chance for your question to be answered quickly if you include a copy-pastable example of what gives you an error (with imports and data).
From what I infer from what you say, you have a dataframe with a datetime column ‘Date’ and some values ‘y_data’.
Here is a code to explain what causes the error you see.
import pandas as pd
import hvplot.pandas
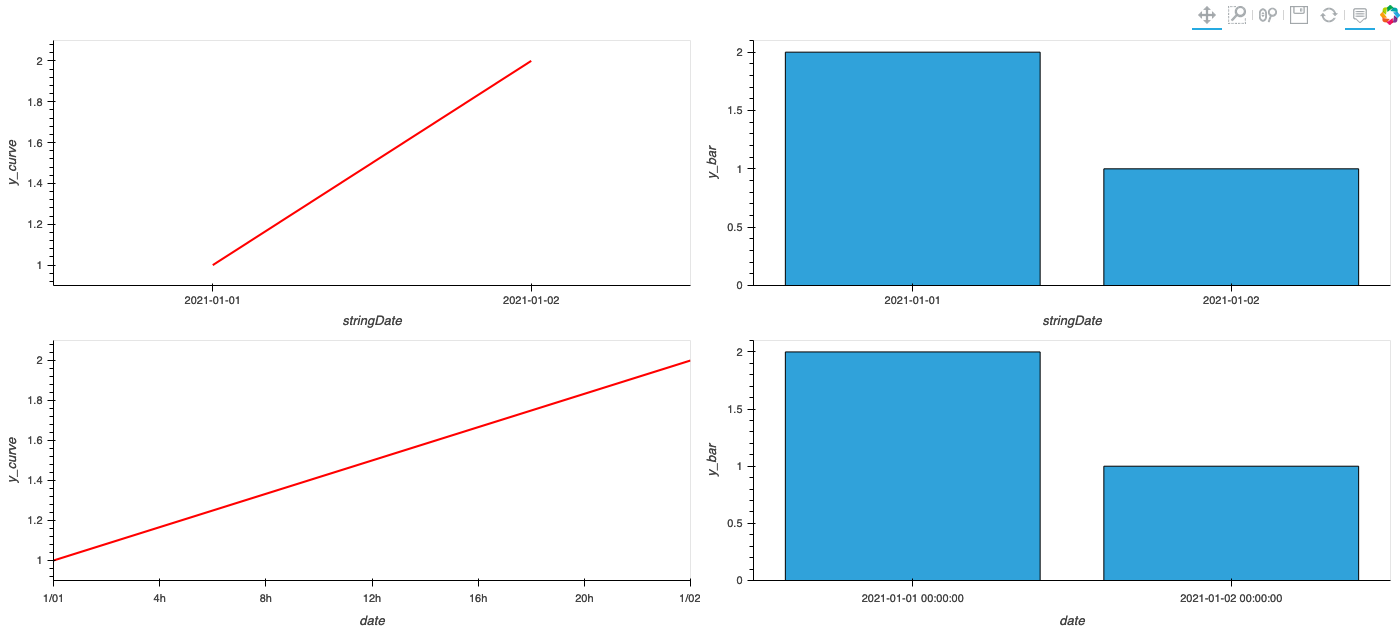
df = pd.DataFrame(dict(stringDate=('2021-01-01','2021-01-02'),y_curve=(1,2),y_bar=(2,1)))
df['date'] = pd.DatetimeIndex(df.stringDate)
stringdate_curve = df.hvplot(y='y_curve',x='stringDate').opts(color='red')
stringdate_bar = df.hvplot.bar(y='y_bar',x='stringDate')
date_curve = df.hvplot(y='y_curve',x='date').opts(color='red')
date_bar = df.hvplot.bar(y='y_bar',x='date')
(stringdate_curve+stringdate_bar + date_curve + date_bar).cols(2)
As you can see, if you use a string format for the date, both axes of the curve and the bar are categorical and identical (and this results in a successful overlay).
In the case when we use the datetime dtype date in the pandas DataFrame, Holoviews infers a continuous time axis for
hv.Curve but keeps a categorical axis for
hv.Bar (I guess this is how bokeh see Bars) so that they do not overlay anymore (and gives the error you mentionned).
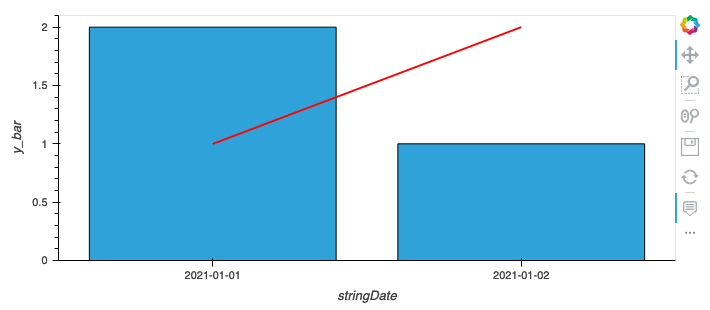
So the easiest solution seems to be to use this overlay (stringdate_bar * stringdate_curve ). But I guess it will work only if your curve have the same xpoints as your bar.
You can also get inspiration from this post Is it possible to combine bar and curve plot using holoviews?. But I did not manage to put @AurelienSciarra hack to use to transform the Range1D of hv.Curve to a FactorRange so that it would result in the overlay that you want to obtain.