Dear all,
How can i convert multiple legends in hv.layout to single legend
here is the code of hvplot to hv.layout
test_north=(rsl_2g[(rsl_2g.RBU==f'North')].\
groupby(['RBU','Comm_Region','hour'])['Sector'].count().reset_index(name='Down_Sectors').hvplot.line(\
x='hour',y='Down_Sectors',by=['Comm_Region'],\
).relabel('2G').opts(toolbar=None,show_grid=True,width=400)+\
rsl_4g[(rsl_4g.RBU==f'North')].\
groupby(['RBU','Comm_Region','hour'])['Cell Name'].count().reset_index(name='Down_Sectors').hvplot.line(\
x='hour',y='Down_Sectors',by=['Comm_Region'],\
).relabel('4G').opts(toolbar=None,show_grid=True,width=400)+\
rsl_3g[(rsl_3g.RBU==f'North')].\
groupby(['RBU','Comm_Region','hour'])['Cell Name'].count().reset_index(name='Down_Sectors').hvplot.line(\
x='hour',y='Down_Sectors',by=['Comm_Region'],\
).relabel('3G').opts(toolbar=None,show_grid=True,width=400)).cols(3)
OutPut highlighted three legends
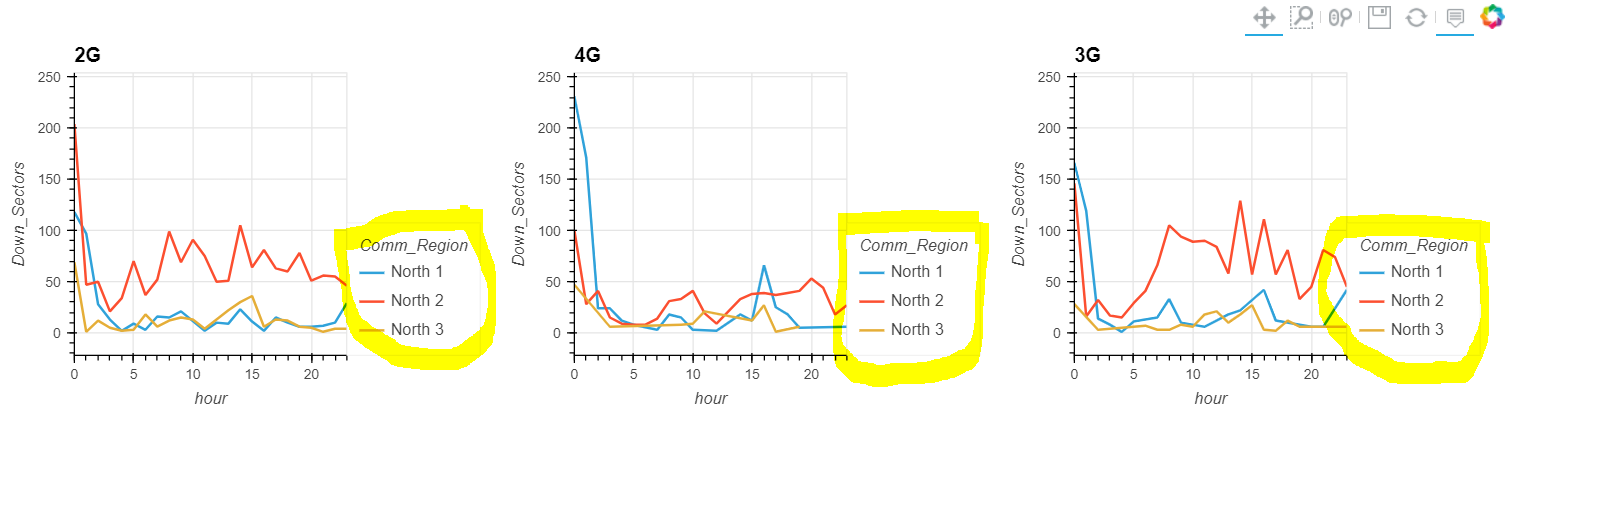
Required how to convert all the same legends to single legend
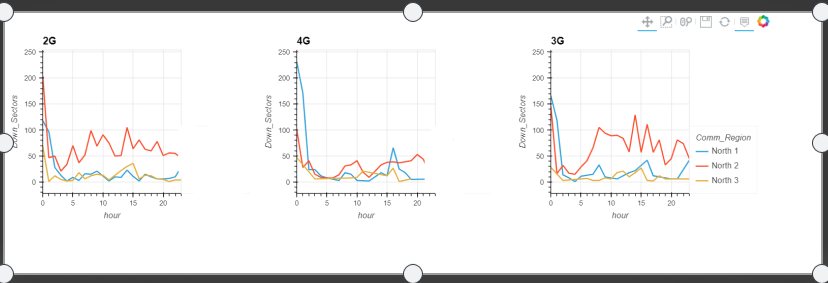
hv.layout
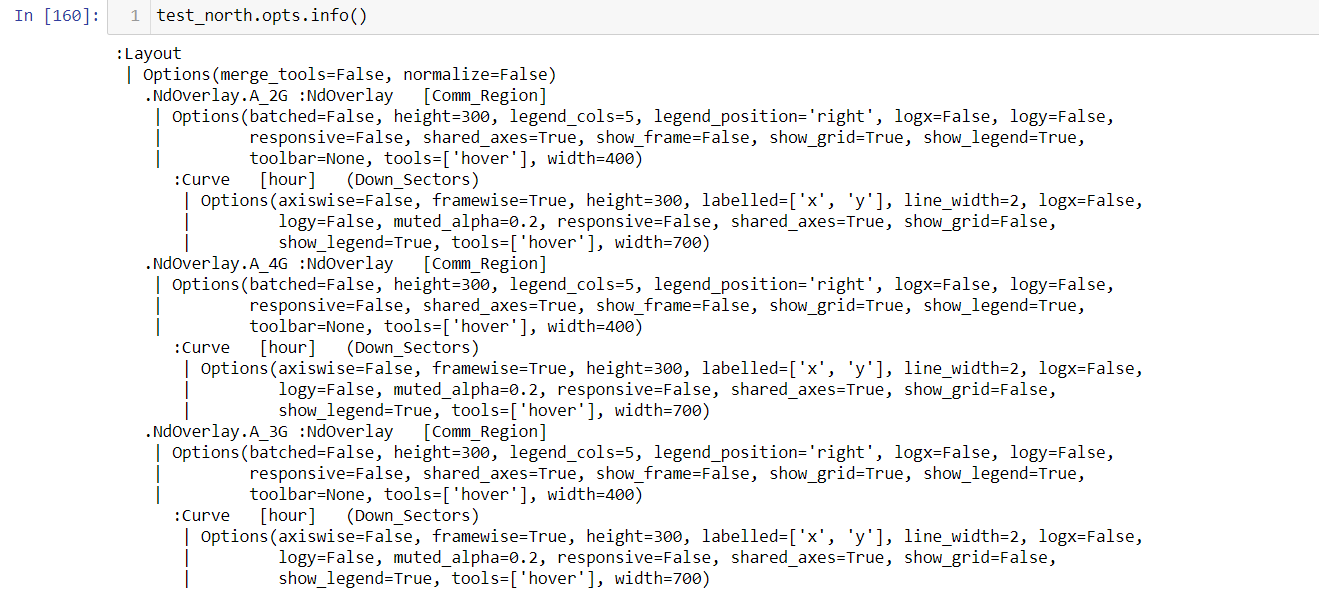
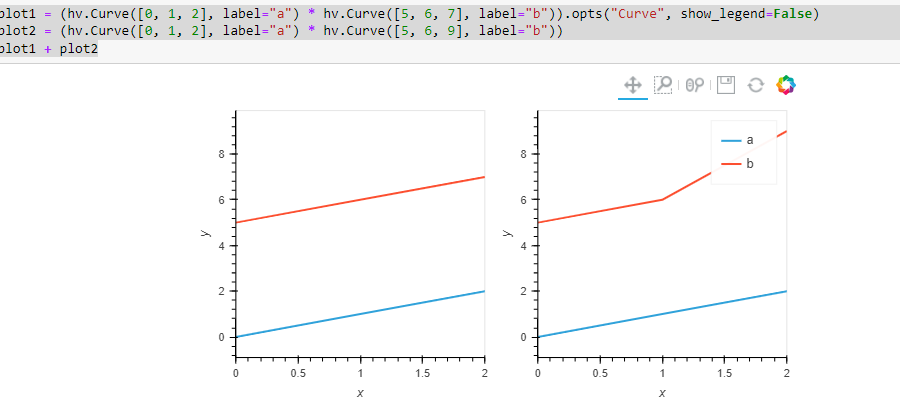
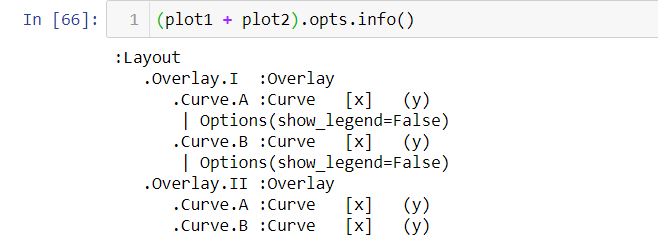
I tried and stuck here.
- show_legend=False remove all legends