I’m trying to create a a gridspace with NdOverlays in each tile.
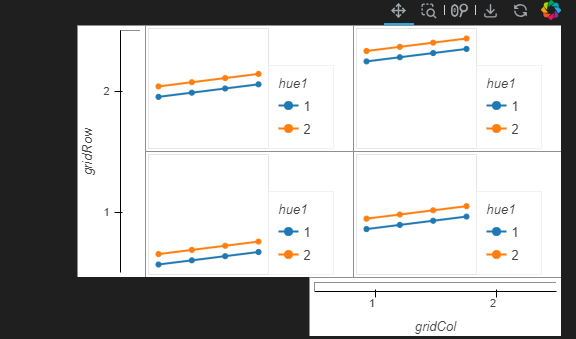
As can be seen in the figure below, it is showing the legend for each figure and therefore the “gridCol” is not shown properly.
It would be better if I can have 1 single legend for all the plots in the gridspace. However, setting the “show_legend=True” for the gridspace doesn’t do anything.
According to the following issue it should be possible, right?
I would have the same question for a “layout” instead of a gridspace. But as far as I understand there is no option in layout to do this automatically and according to the following thread I should manually select a plot and set the legend.
Ticks
Additionally I have a question regarding the xticks and yticks. I would like to show the xticks on the bottom of the gridspace and the yticks on the left size of the gridspace. I don’t immediately see an option in the gridspace to do this. Is there an option to set this?