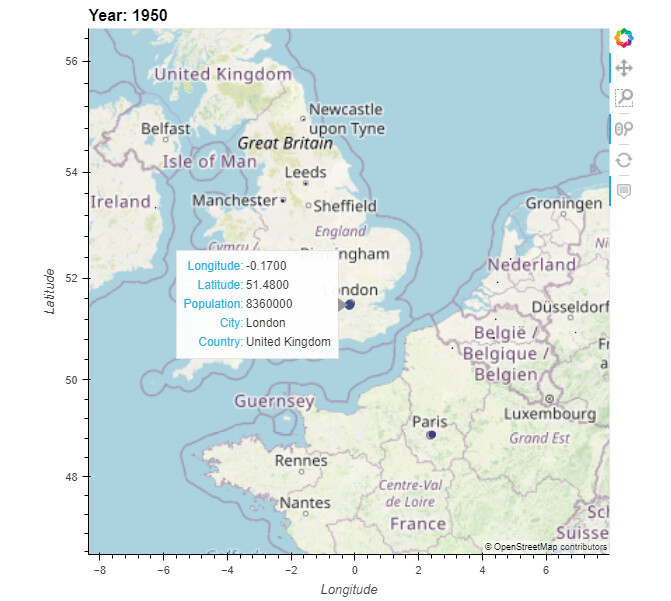
Hi! I’m trying to code similar map to this one GeoViews Gallery - world population and I have two questions. It would be nice to see your tips or solutions:
-
How to hide Latitude and Longitude in hover window of each point?
-
Is there any method to customize the hover window (e.g. colors, fonts)?
The code of the example map:
import pandas as pd
import geoviews as gv
from geoviews import dim

gv.extension('bokeh')


cities = pd.read_csv('../../assets/cities.csv', encoding="ISO-8859-1")
population = gv.Dataset(cities, kdims=['City', 'Country', 'Year'])
points = population.to(gv.Points, ['Longitude', 'Latitude'], ['Population', 'City', 'Country'])

tiles = gv.tile_sources.Wikipedia

tiles * points.opts(
    color='Population', cmap='viridis', size=dim('Population')*0.000001,
    tools=['hover'], global_extent=True, width=600, height=600)
2 Likes
See Configuring plot tools — Bokeh 2.4.2 Documentation, then once you have a bokeh hover_tool = HoverTool(...) object instantiated, pass in with
tools=[hover_tool]
4 Likes
Thanks a lot! It works good.
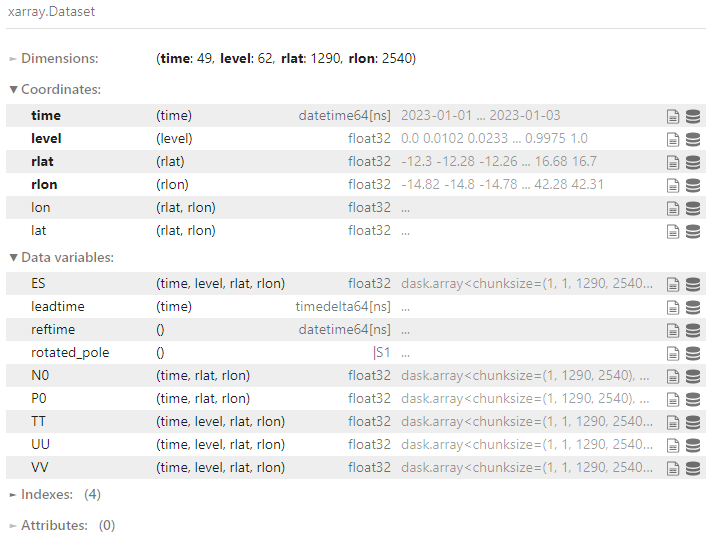
This is great but do you think it’s possible to make it work with a projected and rasterized hvplot on top of an Xarray.Dataset. It seems the Tap stream just does not work (can’t even print out x or y)
...
from holoviews.util.transform import easting_northing_to_lon_lat as to_lon_lat

quadmesh_2 = ds.ES.hvplot.quadmesh(rasterize=True)

tap_stream_2 = hv.streams.Tap(source=quadmesh_2, x=0.0, y=0.0)

def tap_info_2(x, y):
    if isinstance(x, float):
        lon_lat = to_lon_lat(x, y)
        return (
            ds.ES.sel(rlon=lon_lat[0], rlat=lon_lat[1], level=0.878, method="nearest").hvplot(label='ES')
            * ds.UU.sel(rlon=lon_lat[0], rlat=lon_lat[1], level=0.878, method="nearest").hvplot(label='UU')
        )
    else:
        return ds.ES.sel(rlon=0.0, rlat=0.0, level=0.0, method="nearest").hvplot(title=f"{x}")

tap_dmap_2 = hv.DynamicMap(tap_info_2, streams=[tap_stream_2])

(quadmesh_2 + tap_dmap_2)
where ds is
I have tried following this example but for some wird reason my dataset’s hvplot does not return an image and the widgets like it does for the tutorial air Dataset.