hvPlot Tap stream with background map not working

I recreated the example of an xarray map and time-series plot that was posted in https://discourse.holoviz.org/t/simple-panel-example-of-map-time-series-interaction-for-data-cube/1485.

It is quite amazing to see how much can be achieved with only a few lines of code. The code allows me to tap on map cells and receive a time-series for the selected cell.

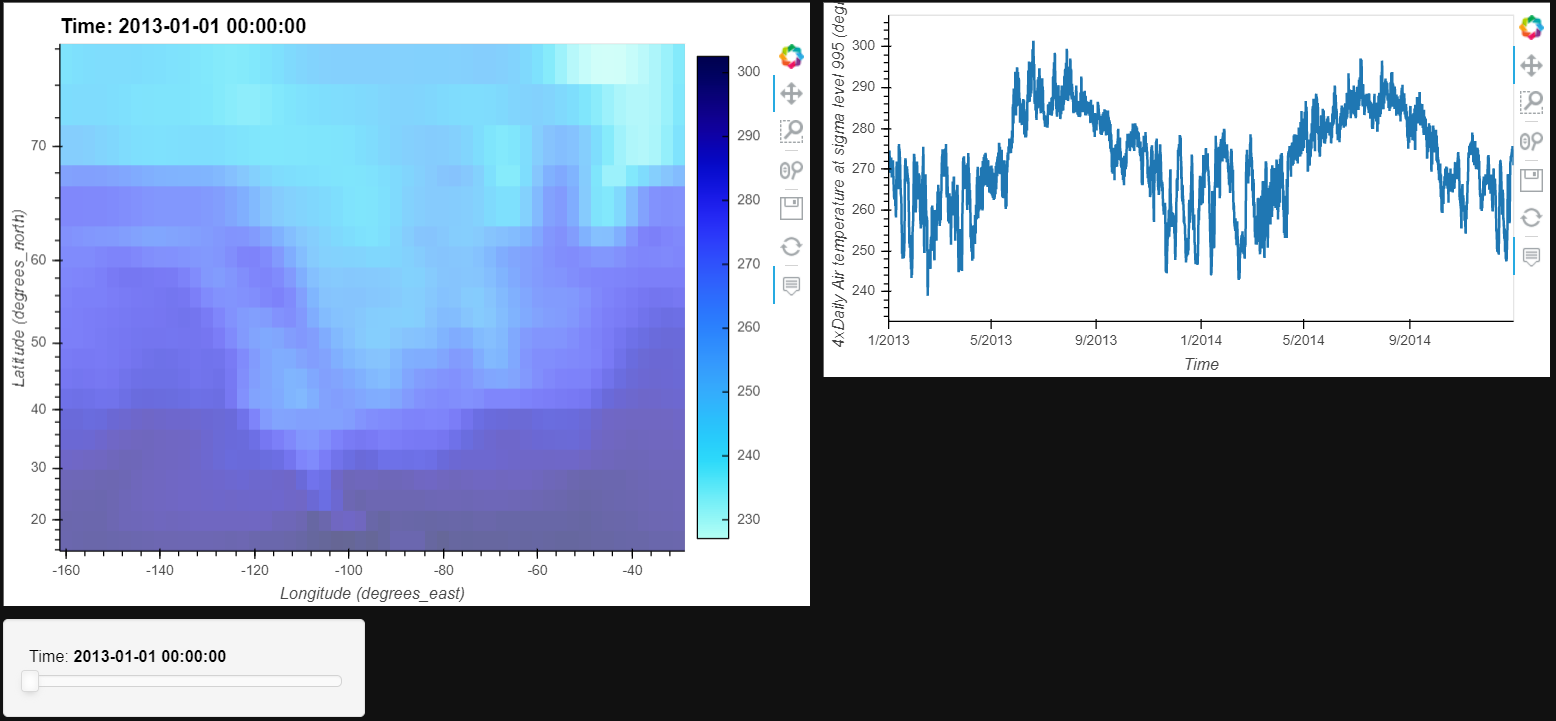
The example works very well when some lines defining a background map are commented out, as can be seen below:

import panel as pn
import xarray as xr
import holoviews as hv
import hvplot.xarray
import cartopy.crs as ccrs

pn.extension()

ds = xr.tutorial.open_dataset('air_temperature')

image, select = ds.hvplot('lon', 'lat', widgets={'time':pn.widgets.DiscreteSlider},
                          alpha = 0.6,
                          frame_width = 500,
                          geo = True)#,
                          #tiles = 'CartoLight',
                          #crs = ccrs.PlateCarree(),
                          #projection = ccrs.PlateCarree(),
                          #project = True,
                          #coastline = '110m')
                    
stream = hv.streams.Tap(source = image.object, x = 50, y = 240)

def timeseries(x, y):
    return ds.sel(lon=x, lat=y, method='nearest').hvplot('time', frame_width = 500)

pn.Row(pn.Column(image, select), pn.bind(timeseries, x=stream.param.x, y=stream.param.y))

However, it would be great to add a background map for better orientation. But whenever I uncomment the lines in the above code, the tap function stops working.

Does anyone know why? Maybe it has something to do with the projection?

Thank you in advance!

My guess is if you print(x, y) in timeseries, you’ll probably notice that x/y are no longer in degrees. You need to reproject those points to degrees. https://scitools.org.uk/cartopy/docs/latest/crs/index.html#cartopy.crs.CRS.transform_point

1 Like

Thanks for your advice!
I added print(x, y) and checked the response in the command prompt (I also checked with a similar project that uses different data).
Without background map, the coordinates are printed in the prompt. With background map, I don’t get any response.

Probably related to the fact that once you turn on a background map, it becomes a gv.Overlay.

Yes same issue as this. Would suggest leaving off the tile source for now, attaching the stream, and then manually overlaying it on a tile source imported from gv.tile_sources.

1 Like

@timsta95 I got the same problem as you. I found in current situation the hv.streams.Tap need a source setting of geoviews object. But when you use a coastline, the image became a overlay object. When I set the source as image.Image.I (stream = hv.streams.Tap(source = image.Image.I, x = 50, y = 240)
), it works fine.

1 Like