I’ve seen similar questions being posted here but none quite answer what I’m looking for. I have a plot with multiple curves: 20+ million data points | Kaggle
The default hover tool displays the x, y coordinates, I was hoping to extend this hover tool to display the parameter in addition to the x,y coordinates. If it’s possible, ideally would like to have the hover tool be sticky to the lines when hovering over them.
Object 'curve' has kdims [Dimension('time')] and vdims [Dimension('value'), Dimension('parameter')]

                           time     value parameter
0 2022-10-20 11:17:13.718341888 -4.677184         a
1 2022-10-20 11:17:13.917509632 -3.540468         a
2 2022-10-20 11:17:14.116676864  0.831614         a
3 2022-10-20 11:17:14.314843136  5.824959         a
4 2022-10-20 11:17:14.514009600  3.769655         a
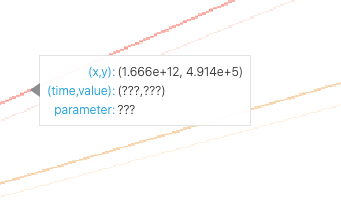
custom_tooltips = [
    ("(x,y)", "($x, $y)"),
    ("(time,value)", "(@time,@value)"),
    ("parameter", "@parameter"),
]
custom_hover = bk.models.HoverTool(tooltips=custom_tooltips)