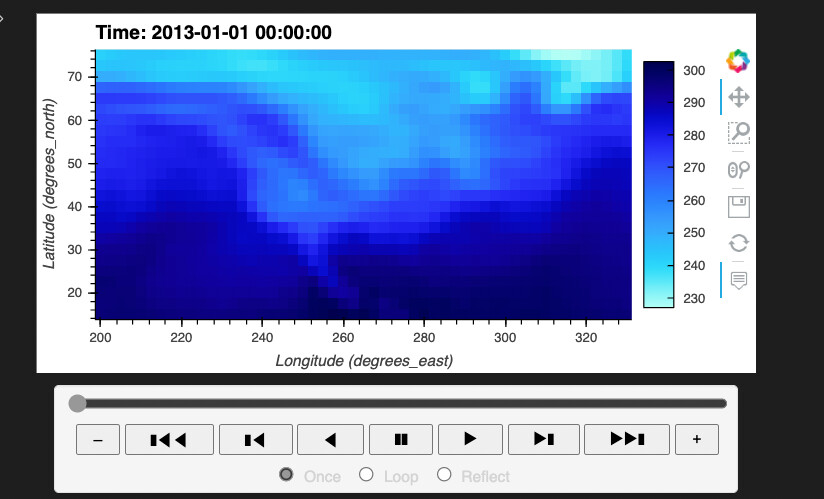
I am wondering if there is a way to customize the scrubber that automatically appears in this example plot. I would imagine there is a way to do this using panel to add customizations, such as a plot/pause button, having the slider initial position at the last time, or being able to save gif’s. I haven’t found much documentation on this subject matter.
import xarray as xr
import hvplot.xarray
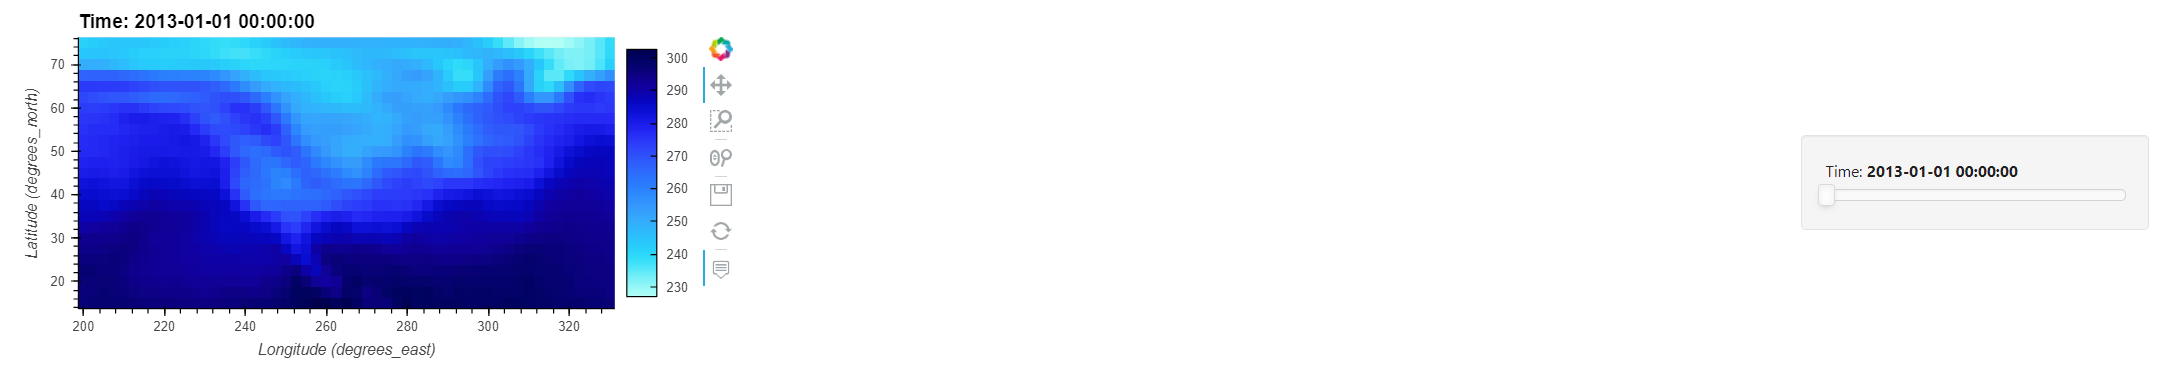
air_ds = xr.tutorial.open_dataset('air_temperature').load()
air = air_ds.air
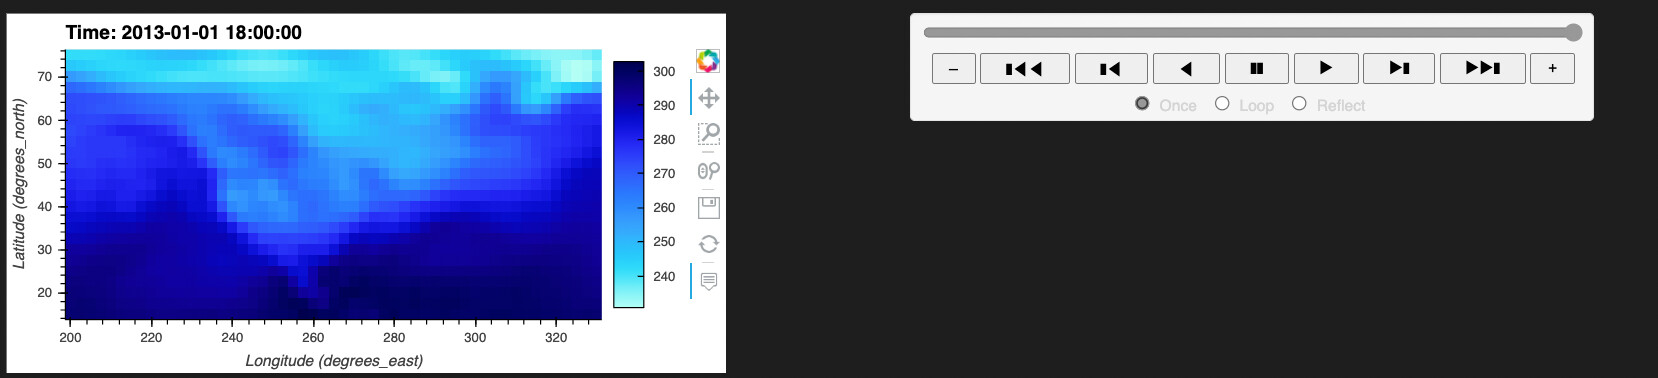
hvp=air.isel(time=slice(0,4)).hvplot(groupby='time', width=600)
hvp
perhaps I used a bad example because I thought the feature would be a bit easier to translate between libraries but what is the syntax to get this to work in a geoviews sense. With this approach to plotting I’m not sure how to go about adding the syntax in that you added