How can I add an extra series alongside the x,y,z input to Quadmesh, so that it will display say z2 value as well, in the tooltip that appears when you hover over the chart?
Thanks for any help
Thanks but I cannot get that to work for me. The example uses a pandas dataset, but as far as i can see, that isn’t supported by quadmesh.
Currently i am using an hv dataset
dataset3d = hv.Dataset((x_,y_,z_,z2_),[‘x’, ‘y’], [‘z’,‘z2’])
qmesh = hv.QuadMesh(dataset3d,hover_cols=[‘z2’])
but just displays ??? for z2 in the hover
hover_cols is not a valid keyword arg for hv.QuadMesh:
import numpy as np
import holoviews as hv
from holoviews import opts
hv.extension('bokeh')

n = 8  # Number of bins in each direction
xs = np.logspace(1, 3, n)
ys = np.linspace(1, 10, n)
zs = np.arange((n-1)**2).reshape(n-1, n-1)

ds = hv.Dataset((xs, ys, zs, zs * 2), kdims=["x", "y"], vdims=["z", "z2"])
hv.QuadMesh(ds).opts(tools=["hover"])
Works for me.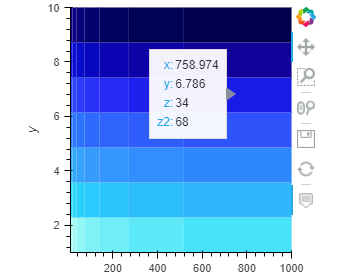
1 Like
Thanks a lot!
This works, though there does seem to be one oddity that i had to work around to get it going with my dataset …
x_ = np.arange(0,11,0.1)
y_ = np.arange(0,1.01,0.01)
x__,y__ = np.meshgrid(x_,y_)
z1_ = griddata((x,y),z,(x__,y__),method=‘linear’)
z2_ = griddata((x,y),z2,(x__,y__),method=‘linear’)
I was using this:
ds = hv.Dataset((x__,y__,z1_,z2_ ), kdims=[“x”, “y”], vdims=[“z”, “z2”])
which produces the heatmap fine, but shows ? in hover for z2
whereas:
ds = hv.Dataset((x_,y_,z1_,z2_ ), kdims=[“x”, “y”], vdims=[“z”, “z2”])
is exactly the same result but z2 hover works.
Thanks again,
Interesting; maybe you can report this to github issues
finaly i have reached my rank in rainbow six siege proboosting.netby using