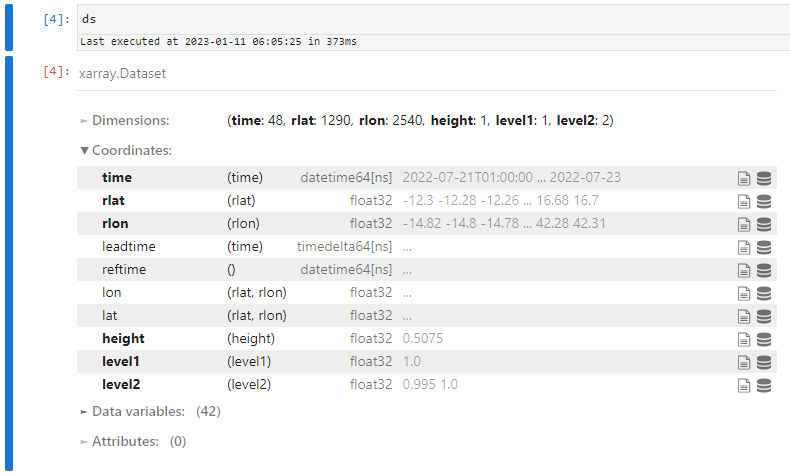
Here is some Example Data that can be loaded by
ds = fstd2nc.Buffer(fst_file_list).to_xarray()
for the none NetCDF files. Once loaded, the Xarray should look like this (but with a lot less timesteps).
I am trying to implement the Holoviews Streams example further developed in this question and I have been succesful to at least replicate the example with some compromises using :
image = ds.TT.hvplot.quadmesh(
                                'rlon',
                                'rlat',
                                cmap='jet',
                                rasterize=True,
                                data_aspect=1,
                                frame_height=500,
                                geo=True,
                            )
stream = hv.streams.Tap(source=image, x=0, y=0)
timeseries = ds.TT.interactive.sel(
                                    rlon=stream.param.x,
                                    rlat=stream.param.y,
                                    level1=1.0,
                                    method="nearest"
                                    ).hvplot('time')
that results in something that looks like
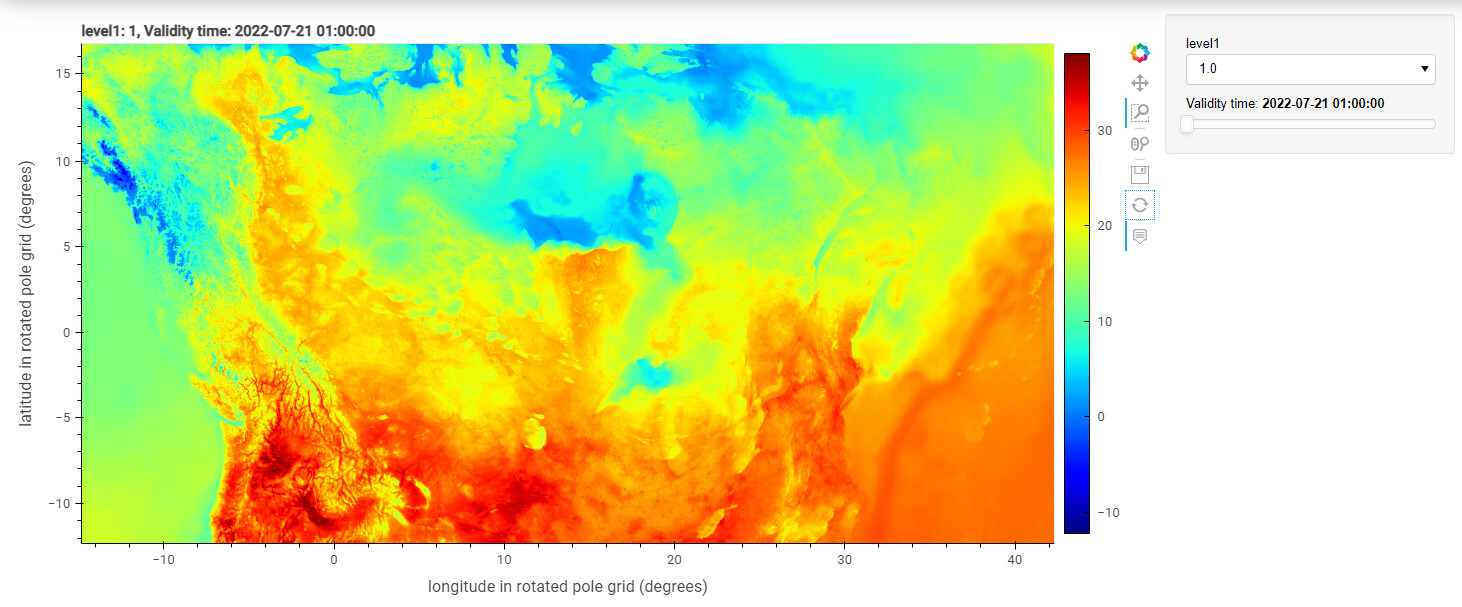
but I would love to have a basemap, coastline and reproject to PlateCarree. I have another app that does this one file at a time with :
gridded_dataset_single_file.TT.hvplot(
                                        cmap='jet',
                                        kind="quadmesh",
                                        rasterize=True,
                                        data_aspect=1,
                                        frame_height=500,
                                        crs=ccrs.PlateCarree(),
                                        projection=ccrs.PlateCarree(),
                                        project=True,
                                        geo=True,
                                        coastline=True,
                                        widget_location='bottom'
                                    )
That results in something that looks like

My ideal would be the streams.Tap to actually work with the reprojected lon/lat and for the image to be in PlateCarree instead of being forced (by I am not sure what) to keep the original rlon/rlat coordinates. Can someone explain to me how to take the final steps please?
Full code for most recent solution :
import panel as pn
import panel.widgets as pnw
import xarray as xr
import hvplot.xarray
import fstd2nc
import cartopy.crs as ccrs
import warnings
import collections
import glob
import holoviews as hv

pn.extension( loading_spinner='arcs' , loading_color='#3ef211' , sizing_mode = 'stretch_width' , template='material' )
pn.state.template.param.update(site="Panel", title="Streams Demo")

warnings.simplefilter(action='ignore', category=FutureWarning)
collections.Callable = collections.abc.Callable
BASE_PATH = '/fst/'
fst_file_list = sorted(glob.glob(f'{BASE_PATH}2022*'))
ds = fstd2nc.Buffer(fst_file_list).to_xarray()
image = ds.TT.hvplot.quadmesh(
                                'rlon',
                                'rlat',
                                cmap='jet',
                                rasterize=True,
                                data_aspect=1,
                                frame_height=500,
                                geo=True,
                            )
stream = hv.streams.Tap(source=image, x=0, y=0)
timeseries = ds.TT.interactive.sel(
                                    rlon=stream.param.x,
                                    rlat=stream.param.y,
                                    level1=1.0,
                                    method="nearest"
                                    ).hvplot('time')
pn.Column(image, timeseries.dmap()).servable('main')