I’m trying to create a dashboard with some settings on the left and a plot layout with two subplots in one column.
My requirements are
- The settings should be on the left with a fixed size of 300px.
- The upper
price plotshould be- a Curve plot.
- responsive horizontally and vertically.
- The lower
delta plotshould be- a Bar chart
- responsive vertically
- fixed horizontally at 300px.
- It should be clear to the user if the delta is positive or negative.
- The date x-axis of the two plots should be linked.
- The value and delta y-axis of the two plots should not be linked.
- Preferably I would like one common toolbar on the top of the plots.
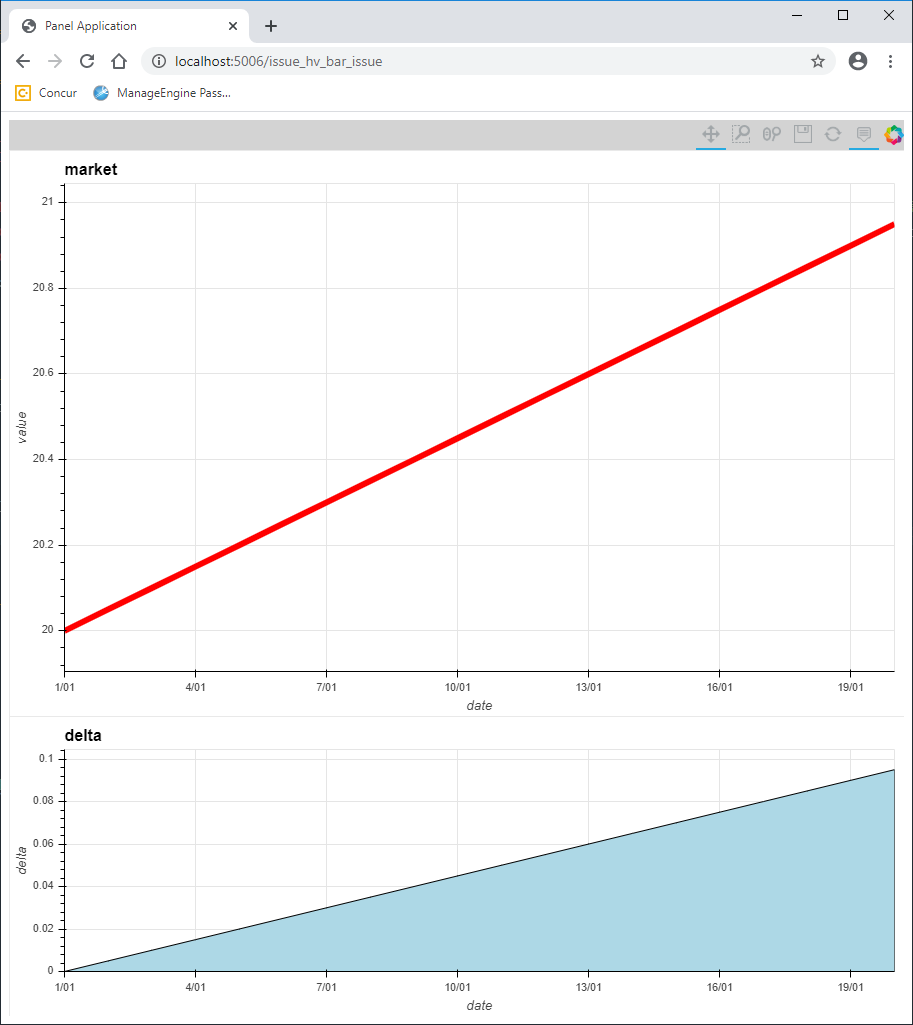
The best approximation so far is shown below but it does not satisfy my requirements as
- The upper price plot is not responsive vertically
- There are two toolbars instead of one.
- The lower delta plot is a step plot.
I can get some of the missing things working but then some of the requirements already satisfied no longer are satisfied.
How do I solve this problem?
Best Approximation So Far
import holoviews as hv
import hvplot.pandas
import pandas as pd
import panel as pn
from bokeh.models.formatters import DatetimeTickFormatter
from holoviews import opts

pn.config.sizing_mode = "stretch_width"

N = 365
START = pd.Timestamp("2020-01-01")
OFFSET = pd.Timedelta(days=1)
DATES = [START + n * OFFSET for n in range(0, N)]
PRICES = [20 + n / N for n in range(0, N)]
FORECASTS = [20 + 1.1 * n / N + 0.5 for n in range(0, N)]
DELTA = [0.1 * n / N for n in range(0, N)]

MARKET_DF = pd.DataFrame({"date": DATES, "value": PRICES,})
FORECASTS_DF = pd.DataFrame({"date": DATES, "value": FORECASTS,})
DELTA_DF = pd.DataFrame({"date": DATES, "delta": DELTA,})

DATETIME_TICK_FORMATTER = DatetimeTickFormatter(days="%d/%m", months="%d/%m/%Y", years="%d/%m/%Y",)
PRICE_OPTS = opts.Curve(line_width=6, responsive=True, show_grid=True)
DELTA_OPTS = opts.Curve(
    height=300, line_width=4, responsive=True, color="lightblue", show_grid=True
)
DELTA_LINE_OPTS = opts.HLine(color="black", line_width=1, alpha=0.6)


def get_app():
    market_plot = (
        MARKET_DF.hvplot(x="date", y="value", c="green", label="market")
        .opts(xformatter=DATETIME_TICK_FORMATTER)
        .opts(PRICE_OPTS)
        .opts(color="red")
    )
    forecasts_plot = (
        FORECASTS_DF.hvplot(x="date", y="value", c="red", label="fumo")
        .opts(xformatter=DATETIME_TICK_FORMATTER)
        .opts(PRICE_OPTS)
        .opts(color="blue")
    )
    price_plot = market_plot * forecasts_plot

    hline_plot = (
        hv.HLine(0, kdims=[hv.Dimension("date"), hv.Dimension("delta")])
        .opts(xformatter=DATETIME_TICK_FORMATTER)
        .opts(DELTA_LINE_OPTS)
    )
    delta_plot = (
        DELTA_DF.hvplot(x="date", y="delta", kind="step")
        .opts(xformatter=DATETIME_TICK_FORMATTER)
        .opts(DELTA_OPTS)
    )
    delta_plot = delta_plot * hline_plot

    plot = pn.Column(
        price_plot.opts(height=600, responsive=True),
        delta_plot.opts(height=300, responsive=True),
        sizing_mode="stretch_both",
    )

    settings_data = pn.Spacer(background="gray", height=300, width=300, sizing_mode="fixed")
    settings_plot = pn.Spacer(background="gray", height=300, width=300, sizing_mode="fixed")
    plot_view = pn.Column(plot)

    return pn.Row(
        pn.Column(
            pn.Row("# Data", margin=(0, 0, 0, 10), aligh="center", sizing_mode="stretch_width"),
            settings_data,
            pn.Row("# Plot", margin=(0, 0, 0, 10), align="center", sizing_mode="stretch_width"),
            settings_plot,
            sizing_mode="stretch_height",
        ),
        plot_view,
        pn.layout.VSpacer(margin=0),  # Hack to stretch Row to max height
        sizing_mode="stretch_both",
        background="lightgray",
    )


get_app().servable()