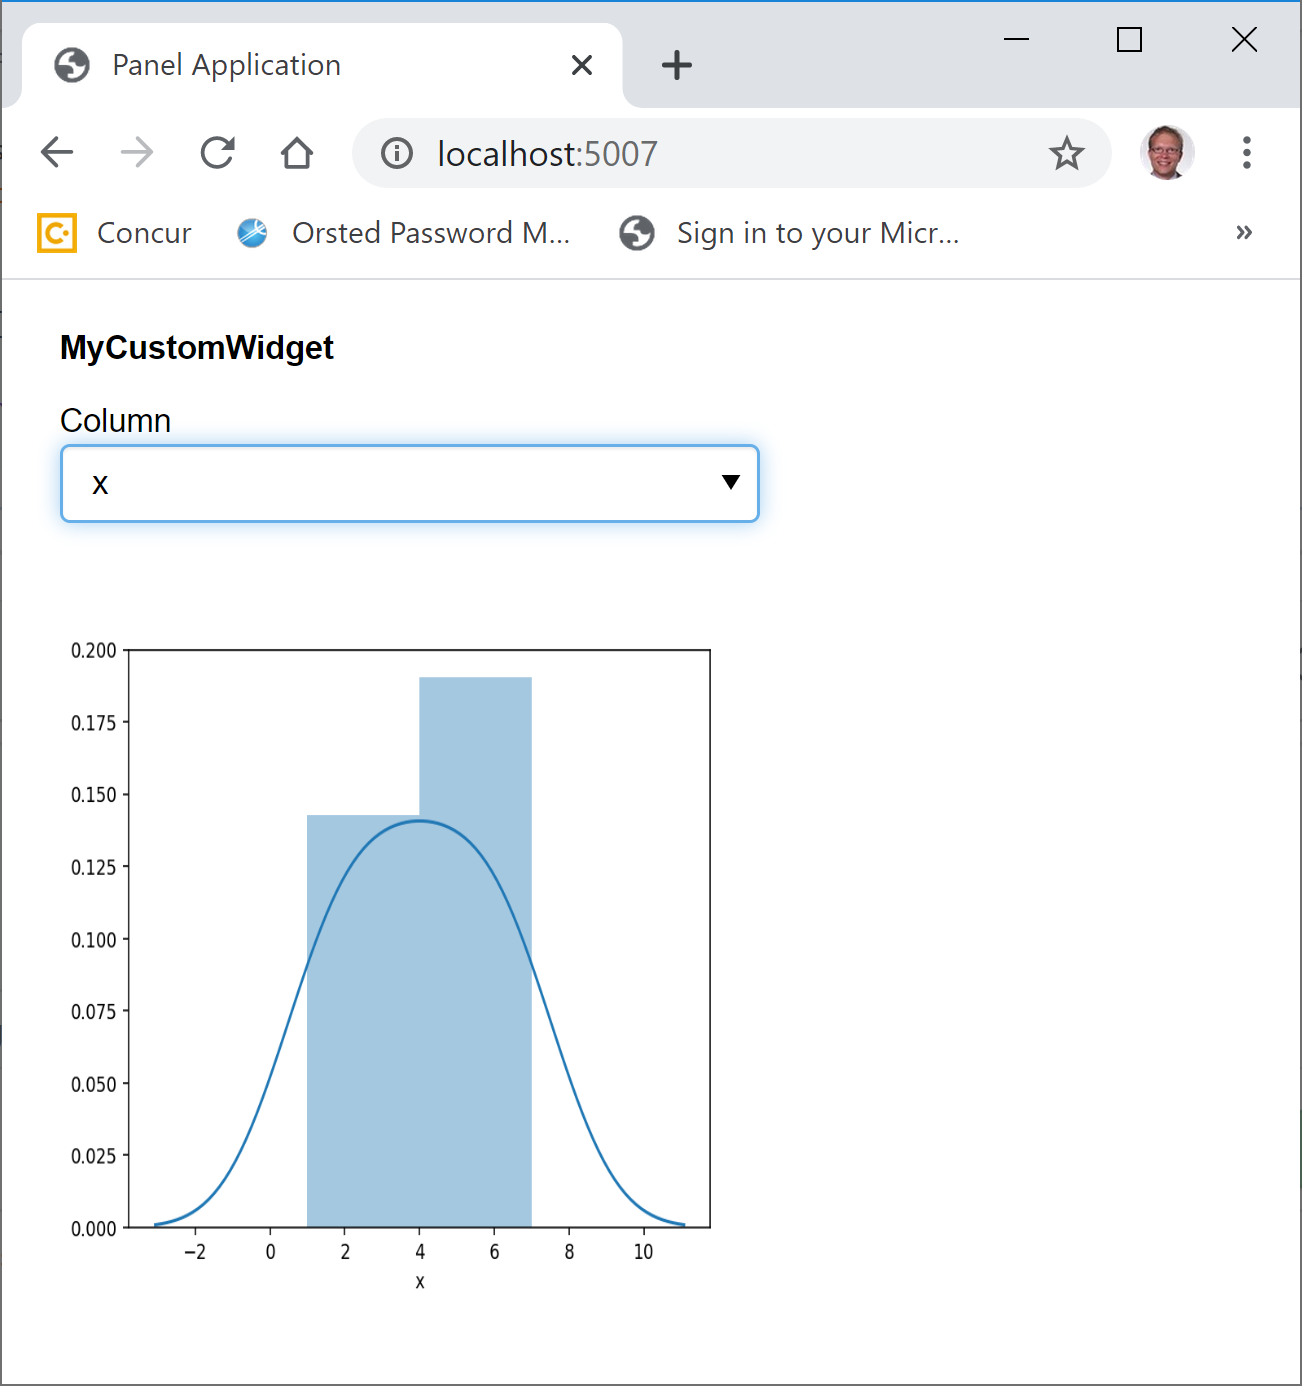
I’d like to create a custom class that takes a dataframe as input and returns a Panel with a dropdown populated by column names and a Matplotlib plot for the selected column. Possibly related to #1072. What’s the best way to accomplish this? I’ve been poring over the documentation for hours and I still haven’t been able to figure it out.
I started with using the interact function, like so:
from sklearn.datasets import load_wine
import seaborn as sns
import pandas as pd
import matplotlib.pyplot as plt
import panel as pn
import param
from panel.interact import interact

def histogram(column):
    ax = sns.distplot(df[column])
    plt.close()
    return pn.pane.Matplotlib(ax.figure)

class MyCustomWidget(pn.pane.base.PaneBase):
    def __init__(self, data):
        pn.extension()
        pn.config.embed = True
        self._data = data
        self._dropdown = pn.widgets.Select(options=list(data.columns.values))
        self.layout = interact(histogram, column=self._dropdown)
        super(pn.pane.base.PaneBase, self).__init__()
This allows me to instantiate the class and immediately return the visualization in a notebook:
df = load_wine(as_frame=True).data
MyCustomWidget(df) # Displays in notebook
The trade-off here is that I can’t place histogram in the class, since interact doesn’t support methods.
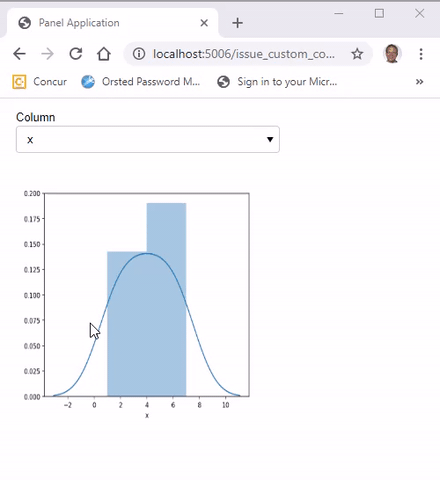
After reading the docs, my impression was that I should use Param instead:
class MyCustomWidget(param.Parameterized):
    column = param.Selector()

    def __init__(self, data):
        self.param.column.objects = data.columns.values

    @param.depends("column")
    def plot(self):
        if self.column:
            ax = sns.distplot(df[self.column])
            plt.close()
            return pn.pane.Matplotlib(ax.figure)
My issue here is that it seems I still have to wrap the instance object in a Panel:
d = MyCustomWidget(df) # No display
pn.Column(d.param, d.plot)
Is there a better way to do this so that I can simply call MyCustomWidget(df) and where all of the logic is contained inside the class?