How to include custom tooltip with png in my plot

Hi,
I’d like to create a custom tooltip displaying a .png image. I’ve found some references (Bokeh, Holoviews) to custom tooltips, but my (non-existing) background in JS and css is not sufficient.

This is what I’ve got:

datadict = dict(x = [1,5],
                y = [4,10],
                img = ['https://raw.githubusercontent.com/holoviz/panel/master/doc/_static/logo_horizontal.png',
                       'https://raw.githubusercontent.com/holoviz/panel/master/doc/_static/logo_stacked.png'])
df_test =pd.DataFrame.from_dict(datadict)
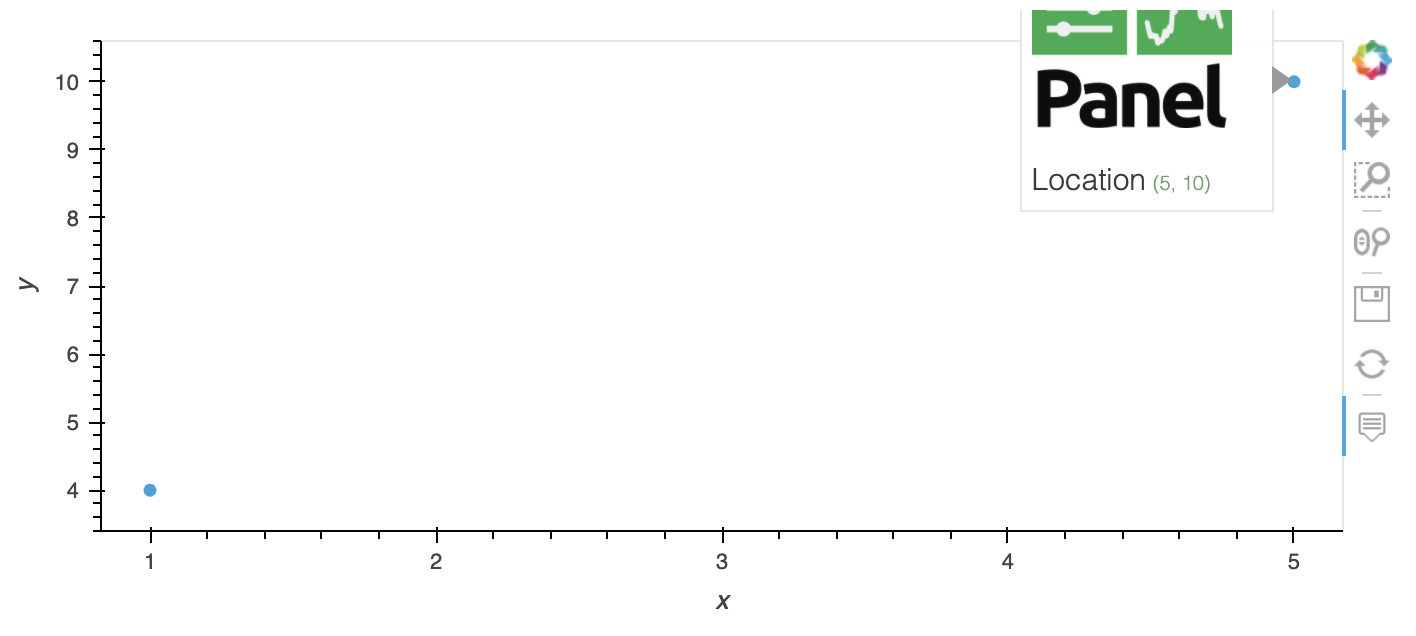
df_test.hvplot.scatter(x='x',y='y',hover_cols=['img'])

image
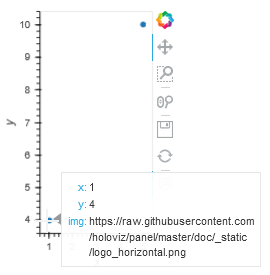
Obviously this is not rendering the image, only the text. Anyone who can offer some support here?
Thanks!

You can modify the HTML as needed but the a basic example looks like this:

datadict = dict(x = [1,5],
                y = [4,10],
                img = ['https://raw.githubusercontent.com/holoviz/panel/master/doc/_static/logo_horizontal.png',
                       'https://raw.githubusercontent.com/holoviz/panel/master/doc/_static/logo_stacked.png'])

hover = HoverTool(tooltips="""
    <div>
        <div>
            <img src="@img" width=100 style="float: left; margin: 0px 15px 15px 0px; border="2"></img>
        <div>
            <span style="font-size: 15px;">Location</span>
            <span style="font-size: 10px; color: #696;">(@x, @y)</span>
        </div>
    </div>

""")

df_test =pd.DataFrame.from_dict(datadict)
df_test.hvplot.scatter(x='x',y='y', hover_cols=['img'], tools=[hover])

3 Likes