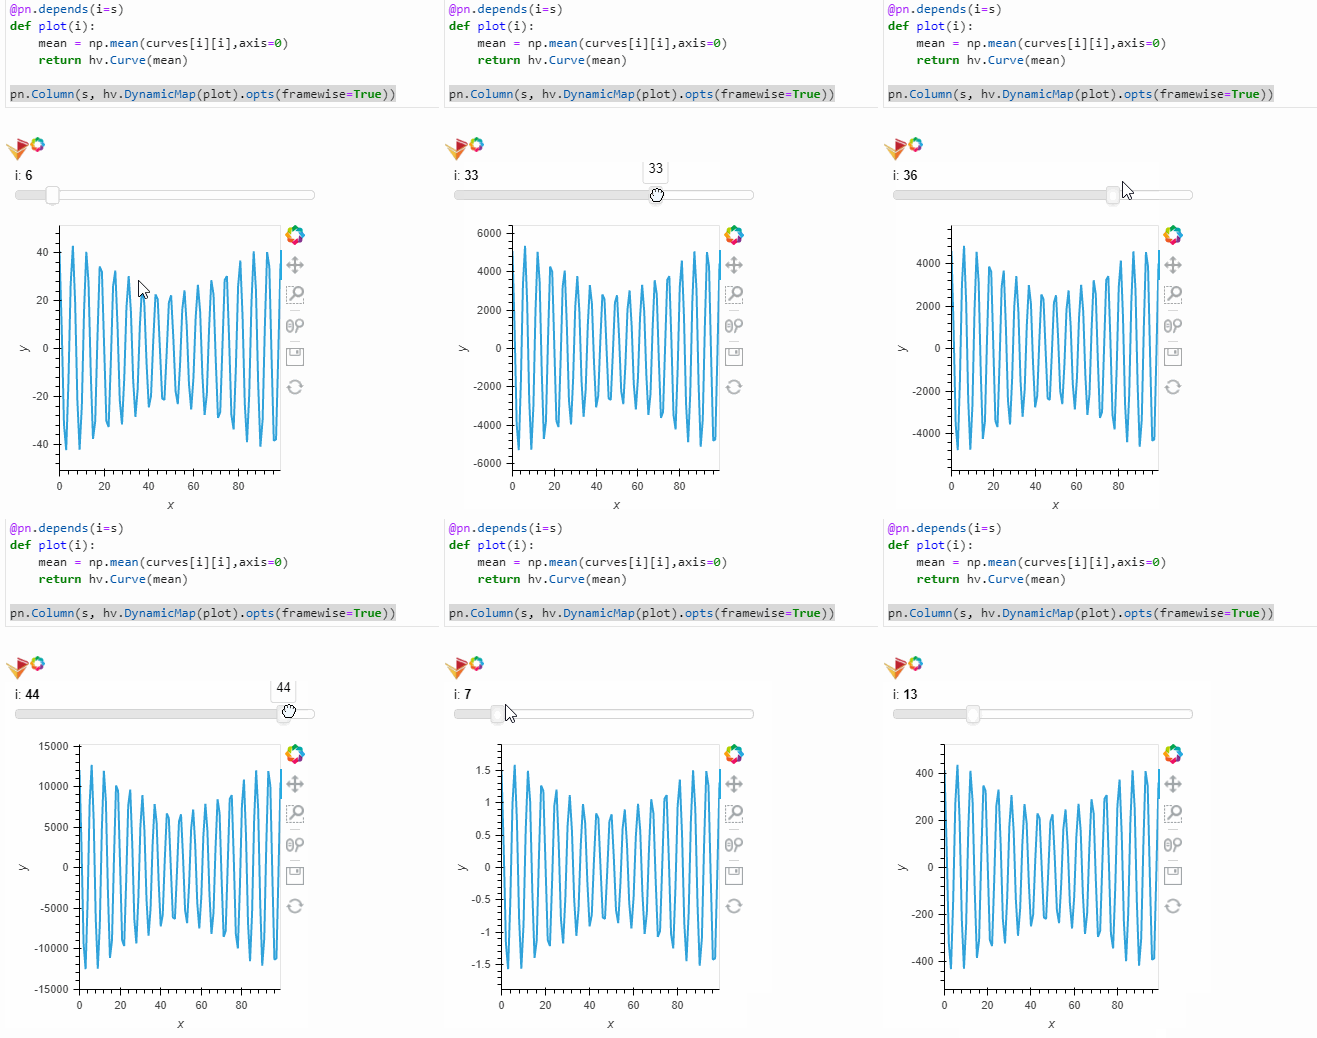
From one plot yielded to DynamicMap to another plot - there might be quite a big change in Y axis range.
Unfortunately that is not propagating through the plots.
Here is illustration - please note that I need to scale Y axis manually each time!
dynamic_yaxis_scaling
Here is the code
from bokeh.models import HoverTool
import holoviews as hv
import panel as pn
from holoviews import opts, streams
from holoviews.plotting.links import DataLink
import numpy as np
pn.extension()
hv.extension('bokeh','matplotlib','plotly',width=100)
data = ([20, 30], [20, 10], ['red', 'blue',])

grid_style = {'grid_line_color': 'black', 'grid_line_width': 1.5,
              'minor_xgrid_line_color': 'lightgray'}
tooltips = [
    ('X', '$x{g}'),
    ('Y', '$y{g}'),
    ('index', '$index'),
    ('color','@color')
]
hover = HoverTool(tooltips=tooltips)
points = hv.Points(data, vdims='color').opts(gridstyle=grid_style, show_grid=True,).redim.range(x=(0, 49), y=(0, 49))
point_stream = streams.PointDraw(data=points.columns(), num_objects=2, source=points, empty_value='black',drag=True,add=False)
table = hv.Table(points, ['x', 'y'], 'color')
DataLink(points, table)

r = np.arange(100*40).reshape([40,100])
sine = np.exp(-(r-2000)**2/2000)*np.sin(r)
curves = [[(il+ix)**3*sine for ix in range(50)] for il in range(50)]

def reactive_curve_plots(data,ind=0):
    name = data['color'][ind]
    xl=round(data['x'][ind])
    il=round(data['y'][ind])
    width=600
    ylim=np.min(curves[il][xl]),np.max(curves[il][xl])
    mean = np.mean(curves[il][xl],axis=0)
    mylim=np.min(mean),np.max(mean)
    linesMean = hv.Curve(mean,label='mean').opts(color='red',axiswise=True,ylim=mylim,apply_ranges=True)
    quants = [10,90]
    quantile = np.quantile(curves[il][xl],q=[i/100.0 for i in quants],axis=0)
    qylim=[(np.min(q),np.max(q)) for q in quantile]
    linesQuantile = hv.Overlay([
        hv.Curve(qv,label='q'+str(q)).opts(line_dash='dashed',color='red',axiswise=True,ylim=qylim[i],apply_ranges=True) for i,(q,qv) in enumerate(zip(quants,quantile))
    ])
    std = np.std(curves[il][xl],axis=0)
    linesStd = hv.Overlay([
        hv.Curve(mean+(2*i-1)*std,label='m'+s+'s').opts(line_dash='dotted',color='green',axiswise=True) for i,s in enumerate(['-','+'])
    ])
    linesOverlay = hv.NdOverlay(
        {i: hv.Curve(curves[il][xl][i,:]).opts(axiswise=True,ylim=ylim) for i in range(curves[il][xl].shape[0])},
        kdims=['k']
    ).opts(width=width)
    return (linesOverlay
            .opts(opts.Curve(color='blue',alpha=0.05,axiswise=True))
            .relabel(group='overlay',label=name)
            *linesMean.opts(axiswise=True)
            *linesQuantile.opts(axiswise=True)
            *linesStd.opts(axiswise=True)).opts(shared_axes=False)

dmap0 = hv.DynamicMap(lambda data: reactive_curve_plots(data,ind=0), streams=[point_stream])
dmap1 = hv.DynamicMap(lambda data: reactive_curve_plots(data,ind=1), streams=[point_stream])

grid = (points + table).opts(
    opts.Layout(merge_tools=False),
    opts.Points(active_tools=['point_draw'], color='color', height=400,
                size=10, tools=[hover], width=400),
    opts.Table(editable=True))

pn.Row(grid.cols(1),
       pn.Row(
           pn.Column(
               dmap0.opts(legend_position='right').relabel(group='curves',label='ZERO (normally RED)'),
               dmap1.opts(legend_position='right').relabel(group='curves',label='ONE (normally BLUE)')
           )
       )
      )
I’m not in love with this code - it’s obviously too crowded to be minimalistic. So if you wish to suggest any updates to make some radical changes - I’m fine with that.
Whatever it takes, really, to get it work!
Thanks in Advance!

