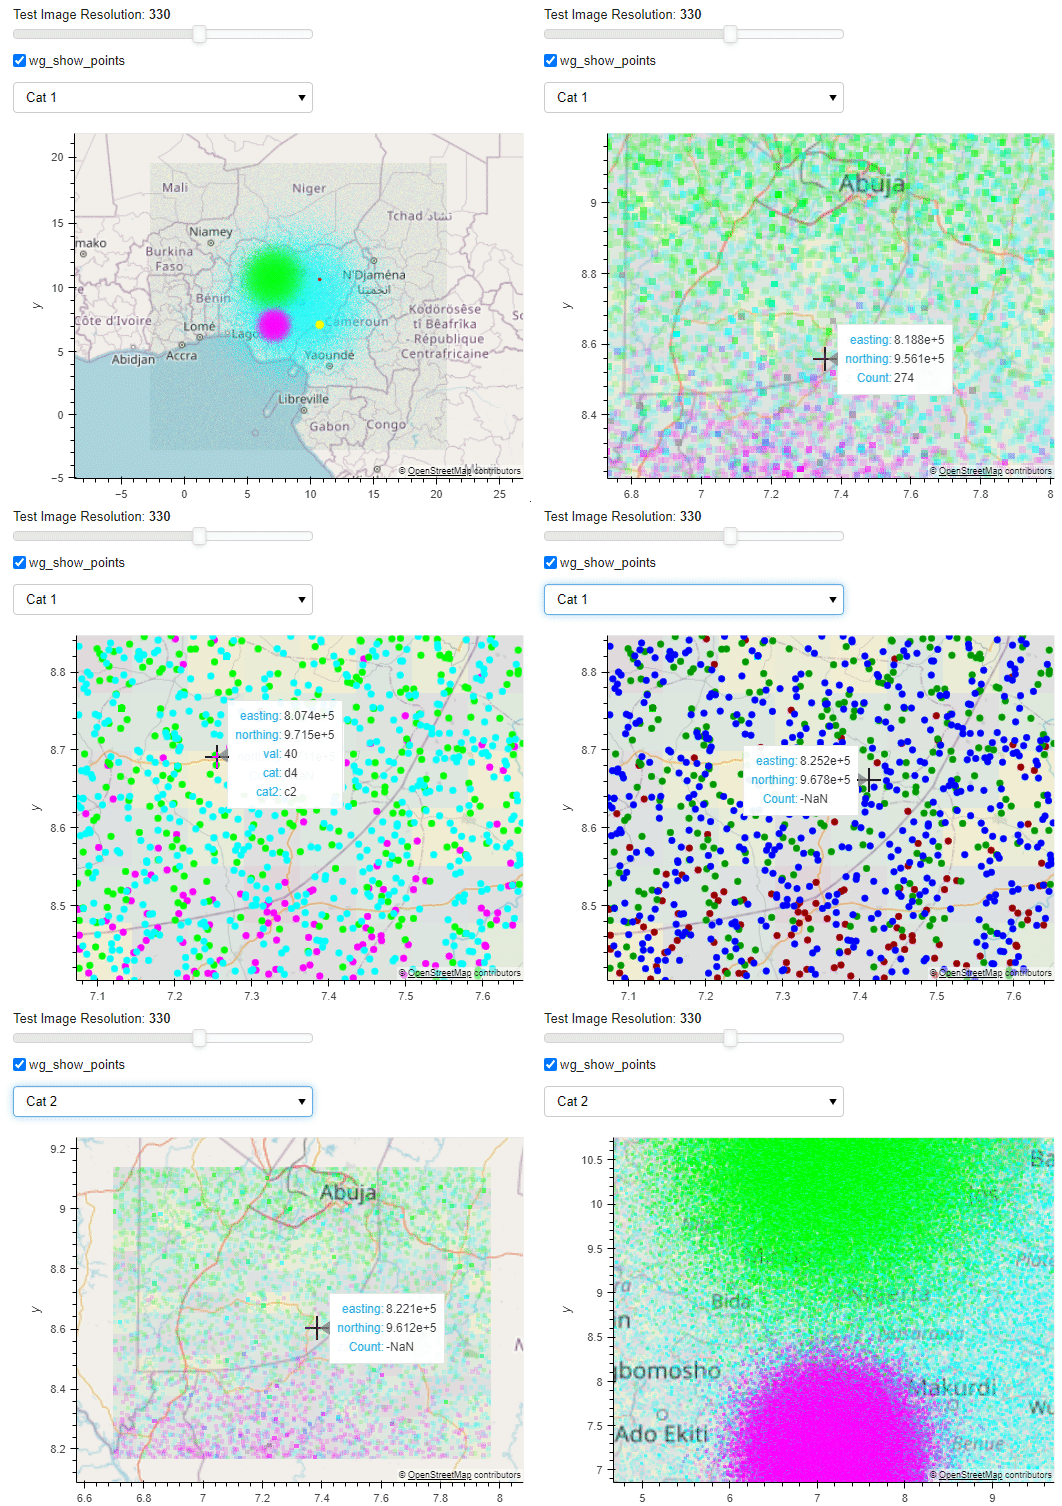
I’m using an example from https://datashader.org/getting_started/Interactivity.html that aggregates the points colorcoded by category. I want this category to be selectable in a widget.
Short standalone example:
# basic config
cmaps = {
    'cat': {'d1': '#FF0000', 'd2': '#FFFF00', 'd3': '#FF00FF', 'd4': '#00FF00', 'd5': '#00FFFF'},
    'cat2': {'c1': '#990000', 'c2': '#009900', 'c3': '#0000FF'}
}
hv.opts.defaults(
  hv.opts.Tiles(active_tools=['wheel_zoom'], height=400, width=600),
)
.
# Same data as in https://datashader.org/getting_started/Interactivity.html except:
#  - x, y changed to easting, northing and
#  - there is a new cat2 category
num=100000
np.random.seed(1)
dists = {cat: pd.DataFrame(odict([
    ('easting',np.random.normal(x,s,num)),
    ('northing',np.random.normal(y,s,num)),
    ('val',val), ('cat',cat), ('cat2',cat2)
]))
         for x,  y,  s,  val, cat, cat2 in
         [(  2,  2, 0.03, 10, "d1", "c1"),
          (  2, -2, 0.10, 20, "d2", "c2"),
          ( -2, -2, 0.50, 30, "d3", "c1"),
          ( -2,  2, 1.00, 40, "d4", "c2"),
          (  0,  0, 3.00, 50, "d5", "c3")] }
df_points = pd.concat(dists,ignore_index=True)
# multiplying the coordinates to make them sensible on a map
df_points['easting'] = (df_points['easting'] + 10) * 10**5
df_points['northing'] = (df_points['northing'] + 10) * 10**5
df_points["cat"]=df_points["cat"].astype("category")
df_points["cat2"]=df_points["cat2"].astype("category")
all_points = hv.Points(df_points)
.
streams=[hv.streams.RangeXY(source=all_points)]
wg_color_by = pn.widgets.Select(
    options={'Cat 1': 'cat', 'Cat 2': 'cat2',},     value='cat'
)

aggregated = hd.datashade(
    all_points,
    aggregator=ds.count_cat('cat'), color_key=cmaps['cat']
)
dynspreaded_aggregated = hd.dynspread(
    aggregated, threshold=0.75, max_px=3, shape='square'
)
display(wg_color_by, (hv.element.tiles.OSM() * dynspreaded_aggregated))
How can I replace ‘cat’ with the value us the wg_color_by widget in the aggregator=ds.count_cat('cat'), color_key=cmaps['cat'] line?
More info if needed:
Full Colab Notebook with everything I tried.
I’ve tried creating watcher and updating dynspreaded_aggregated from there but of course, that did not refresh the already displayed value.
aggregated = hd.datashade(
    all_points,
    aggregator=ds.count_cat('cat'), color_key=cmaps['cat']
)
dynspreaded_aggregated = hd.dynspread(
    aggregated, threshold=0.75, max_px=3, shape='square'
)
# This whole function is not doing anything useful:
# The callback runs but the display does not refresh
def wg_color_by_callback(*events):
    for event in events:
        new_cat = event.new
        aggregated = hd.datashade(
            points_in_viewport,
            aggregator=ds.count_cat(new_cat),
            color_key=cmaps[new_cat]
        )

        dynspreaded_aggregated = hd.dynspread(
            aggregated, threshold=0.75, max_px=3, shape='square'
        )
        hover_for_dynspreaded_aggregated = hv.util.Dynamic(
            hd.aggregate(
                points_in_viewport,
                width=100, height=100, streams=[hv.streams.RangeXY]
            ), operation=hv.Image
        ).opts(tools=['hover'], alpha=0)
wg_color_by_watcher = wg_color_by.param.watch(wg_color_by_callback, ['value'])
wg_color_by.param.trigger('value')
display(wg_color_by, (hv.element.tiles.OSM() * dynspreaded_aggregated))
I also tried creating a function with a @pn.depends decorator:
@pn.depends(color_by = wg_color_by.param.value)
def get_dynspreaded_aggregated_from_depends(color_by):
    print('get_dynspreaded_aggregated_from_depends', color_by, points_in_viewport, camps)
    this_aggregated = hd.datashade(
        points_in_viewport,
        aggregator=ds.count_cat(color_by),
        color_key=cmaps[color_by]
    )

    this_dynspreaded_aggregated = hd.dynspread(
        this_aggregated, threshold=0.75, max_px=3, shape='square'
    )
    return this_dynspreaded_aggregated
and then using it one of these way, but each of them throws an error, even without actually using the color_by in the function:
display(wg_color_by, (hv.element.tiles.OSM()
* get_dynspreaded_aggregated_from_depends
# TypeError: unsupported operand type(s) for *: 'DynamicMap' and 'function'
* hv.DynamicMap(get_dynspreaded_aggregated_from_depends)
# TypeError: cannot unpack non-iterable NoneType object
* hd.regrid(get_dynspreaded_aggregated_from_depends)
# AttributeError: 'function' object has no attribute 'apply'
))
I also tried to use the apply method:
def get_dynspreaded_aggregated_from_apply(
    points_in_viewport, color_by
):
    aggregated = hd.datashade(
        points_in_viewport,
        aggregator=ds.count_cat(color_by),
        color_key=cmaps[color_by]
    )
    dynspreaded_aggregated = hd.dynspread(
        aggregated, threshold=0.75, max_px=3, shape='square'
    )
    return dynspreaded_aggregated

dynspreaded_aggregated_from_apply = points_in_viewport.apply(
    get_dynspreaded_aggregated_from_apply,
    color_by=wg_color_by
)
But I get the same error as with the DynamicMap() and depends():
display(wg_color_by, (hv.element.tiles.OSM()
* dynspreaded_aggregated_from_apply
# TypeError: cannot unpack non-iterable NoneType object
)))
What’s weird is that the same thing with Points worked for the first try. Here I’m using the “Show Points if less than threshold is visible, otherwise show datashade” approach I’ve found in a comment, and as you can see, the colors of the Points are changing as they should, so I just need the aggregated datashade do the same…
